
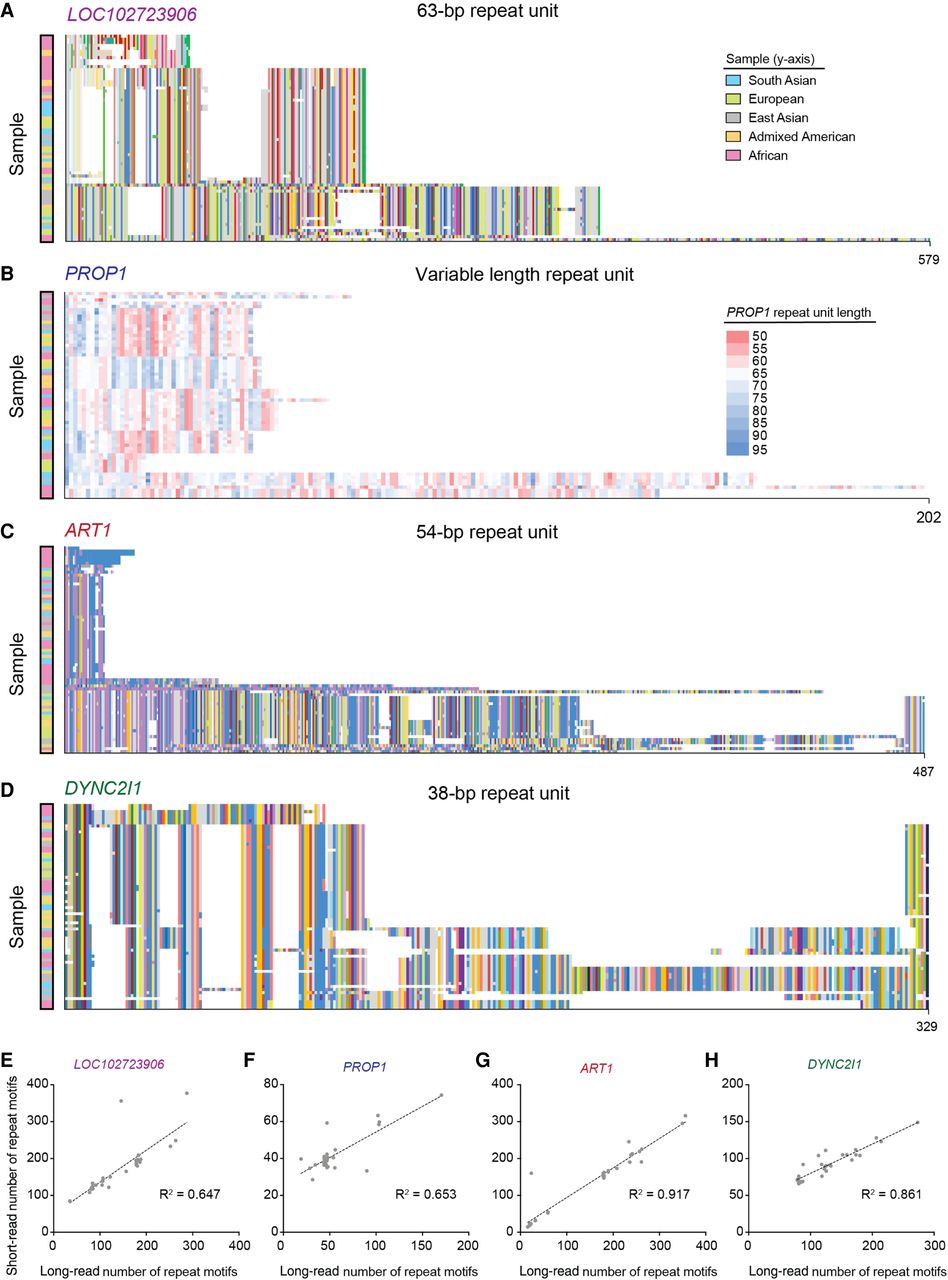
Composition plots and copy number of the top four differentially expanded VNTRs in modern superpopulations. Composition plots for VNTRs in LOC102723906 (A), PROP1 (B), ART1 (C), and DYNC2I1 (D). The colors at the left of the plot denote the superpopulation from which the alleles were obtained (see key), which were previously sequenced and published (Ebert et al. 2021). Gray segments in the plot denote motifs that are rare or private. The y-axis shows the length of the repeat in number of repeat motifs. The heat map legend in B denotes the length of each repeat found in the PROP1 VNTR, which has been plotted based on this unique feature, instead of the motif structure used for the other VNTRs. (E–H) Plots comparing average number of repeat motifs estimated from short-read data and average number of repeat motifs (from both alleles per individual) from phased long-read genomes are given for the same VNTRs, along with their R2 values.


