
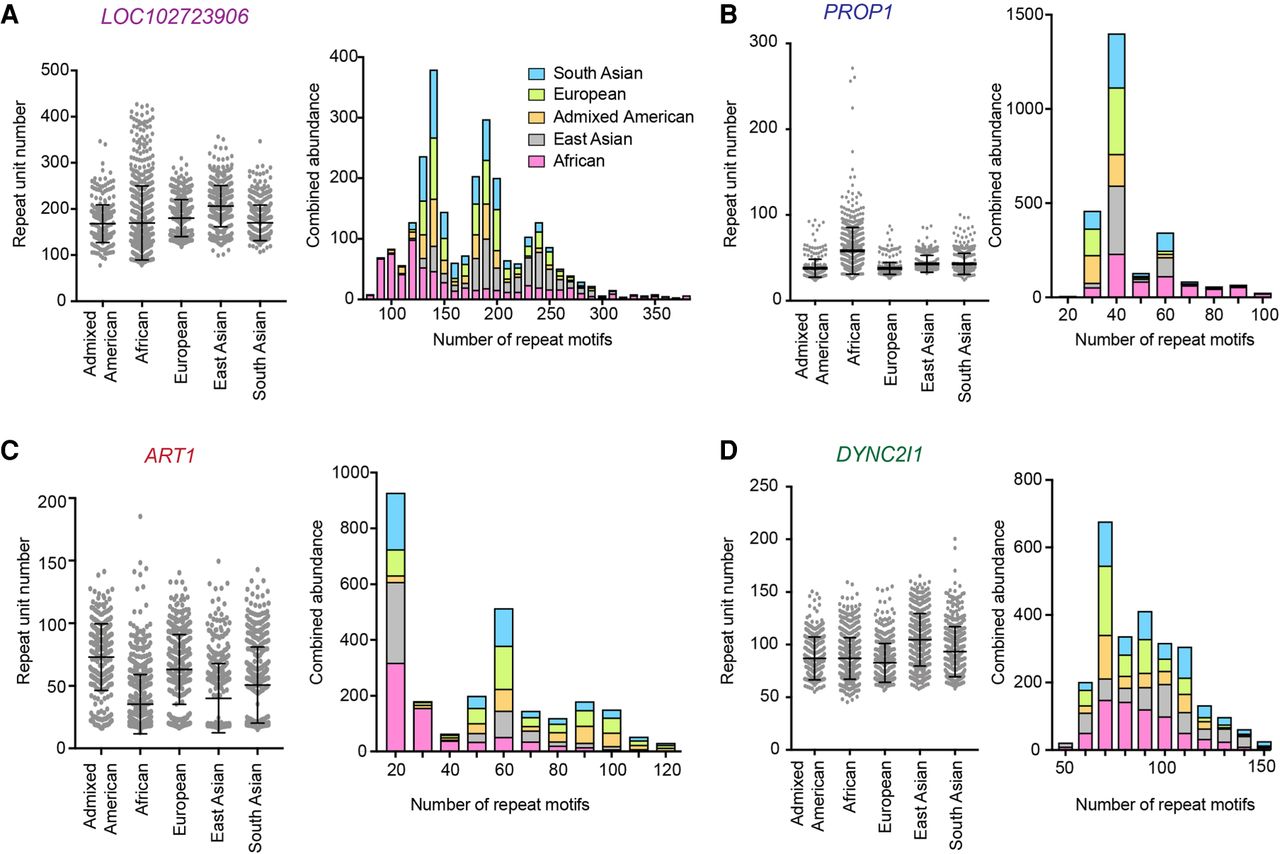
Figure 6.
Length differences in the top four differentially expanded VNTRs in modern superpopulations. (A–D) Individual VNTR copy numbers plus mean and standard deviation for each superpopulation (left) and cumulative abundance binned into groups of 10 repeat motifs (right) for VNTRs in LOC102723906 (A), PROP1 (B), ART1 (C), and DYNC2I1 (D). Trial size for each superpopulation is 347–660. One-way ANOVAs gave P < 0.0001 for each comparison of superpopulations for each VNTR.


