
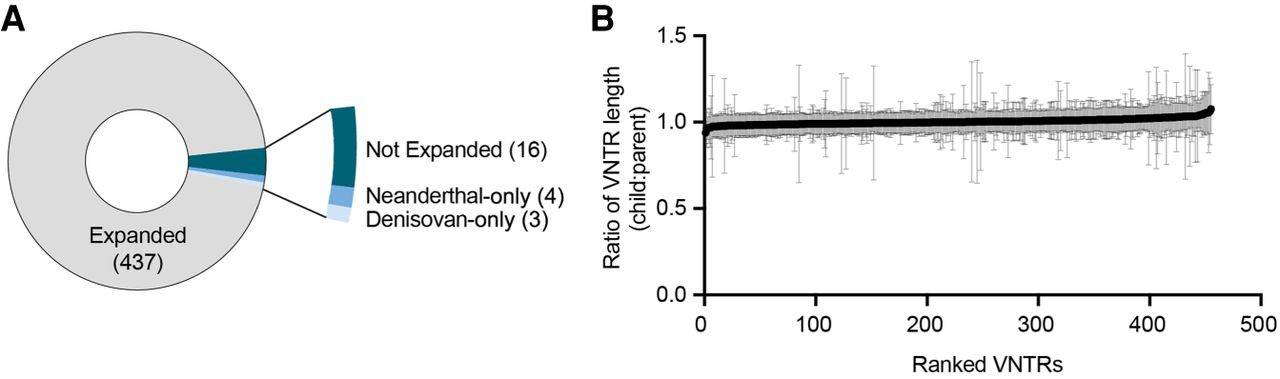
Figure 2.
Timing of expansion in 467 human-specific VNTRs. (A) Pie chart showing number of VNTRs expanded or not expanded in Neanderthal and/or Denisovan genomes. In total, 460 VNTRs were successfully assessed. (B) XY plot showing mean (black dots) and standard deviation (gray lines) ratio of child VNTR length to average parent VNTR length. Data are from 585 trios from the 1000 Genomes Project, and 455 VNTRs were successfully assessed and are ranked by mean ratio on the x-axis.


