
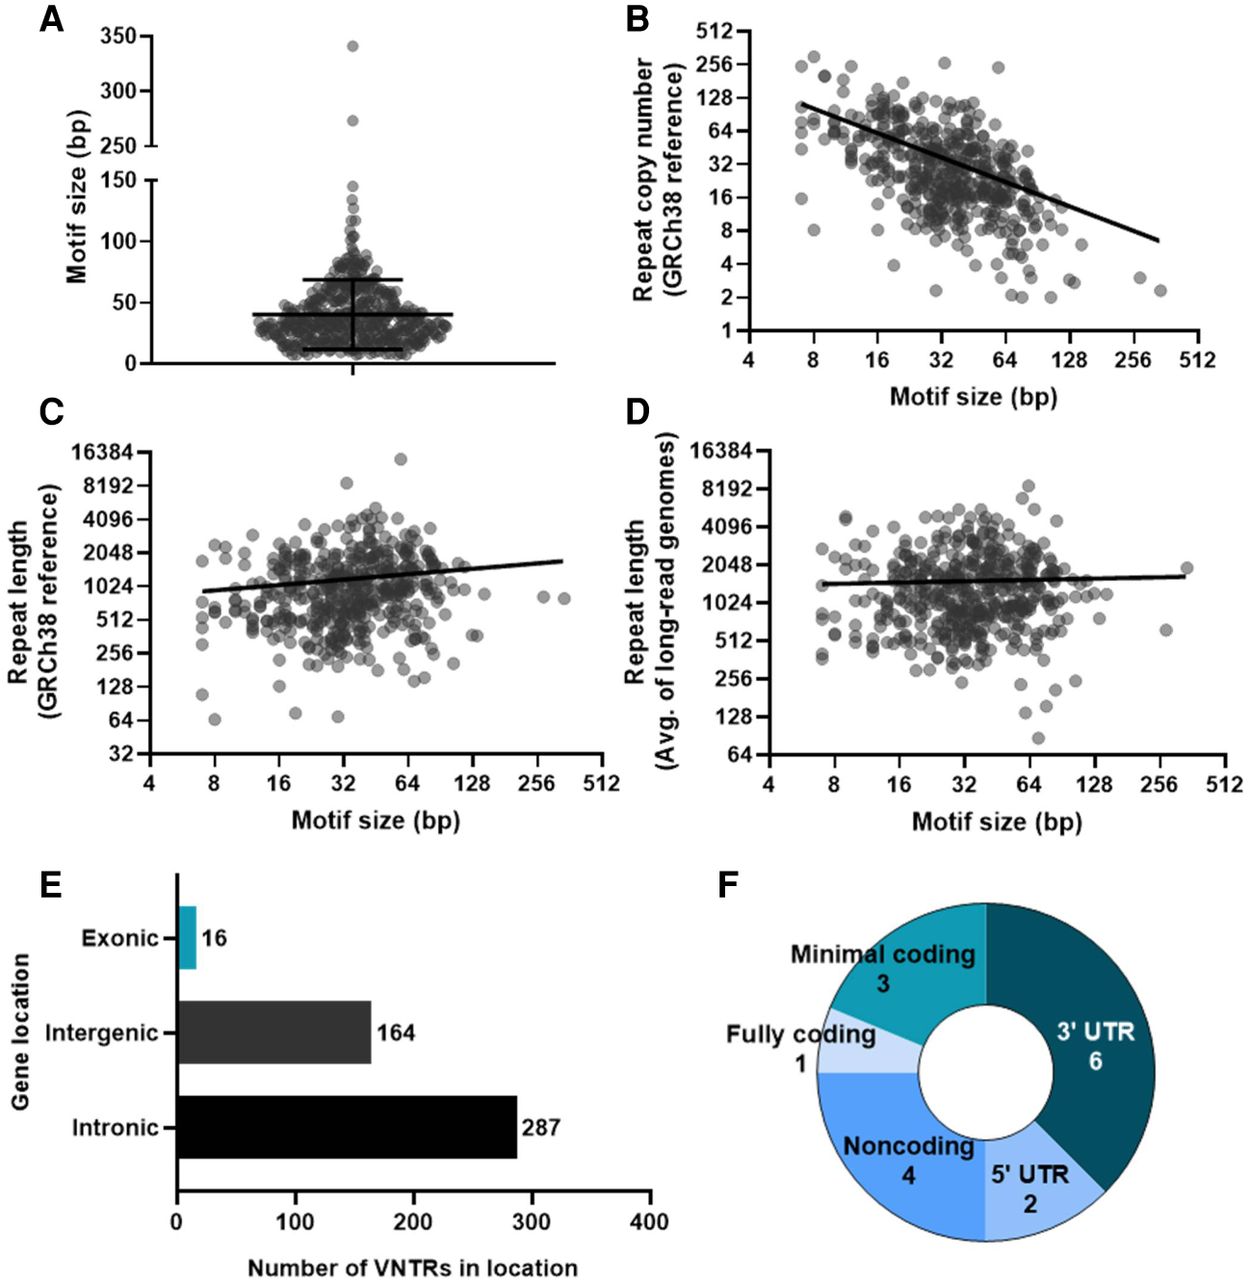
Characterization of 467 human-specific VNTR expansions assessed. (A) Violin plot of motif size for each VNTR. Lines show mean (40.1 bp) and standard deviation (±28.6 bp). (B) Scatter plot of motif size versus repeat copy number in the GRCh38 human reference genome. Axes are log2 and line is log-log (best-fit slope = −0.74). (C) Scatter plot of motif size versus total repeat length in the GRCh38 human reference genome. Axes are log2 and line is log-log (best-fit slope = 0.16). (D) Scatter plot of motif size versus average total repeat length in eight SMRT long-read sequenced genomes representing different superpopulations. Axes are log2 and line is log-log (best-fit slope = 0.034). (E) Bar chart summarizing overall VNTR locations in the genome. (F) Pie chart breaking down specific locations of VNTRs in exons.


