
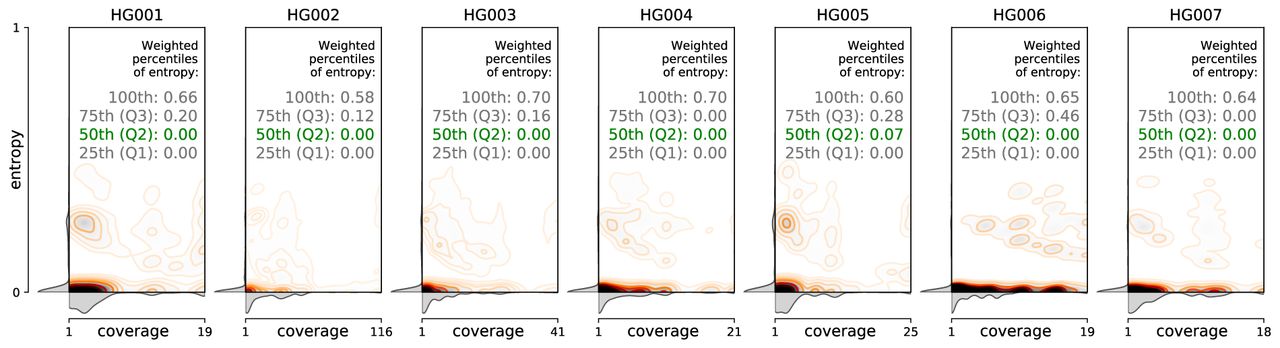
Figure 3.
Distribution of motif entropies in 10-bp windows of candidate PacBio CCS reads aligning to the same chromosomal arms in GIAB data sets HG001 through HG007, with respect to per-window coverage, and the coverage-weighted percentiles of the entropy values.


