
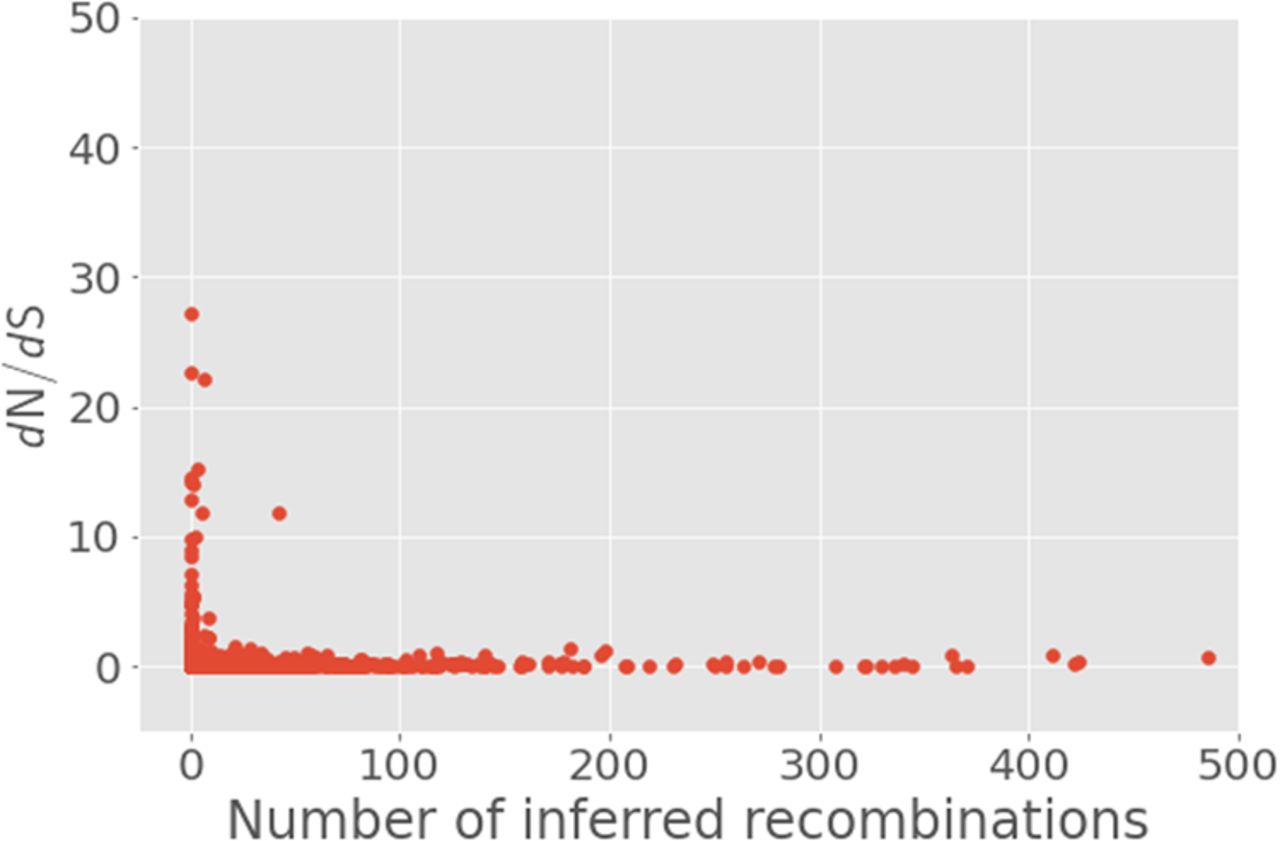
Figure 6.
Scatter plot of number of recombination events versus dN/dS for genes in the pan-genome of the entire Burkina Faso collection of carriage isolates. Genes with abnormally high estimates of dN/dS were excluded from the plot as described in the text.


