
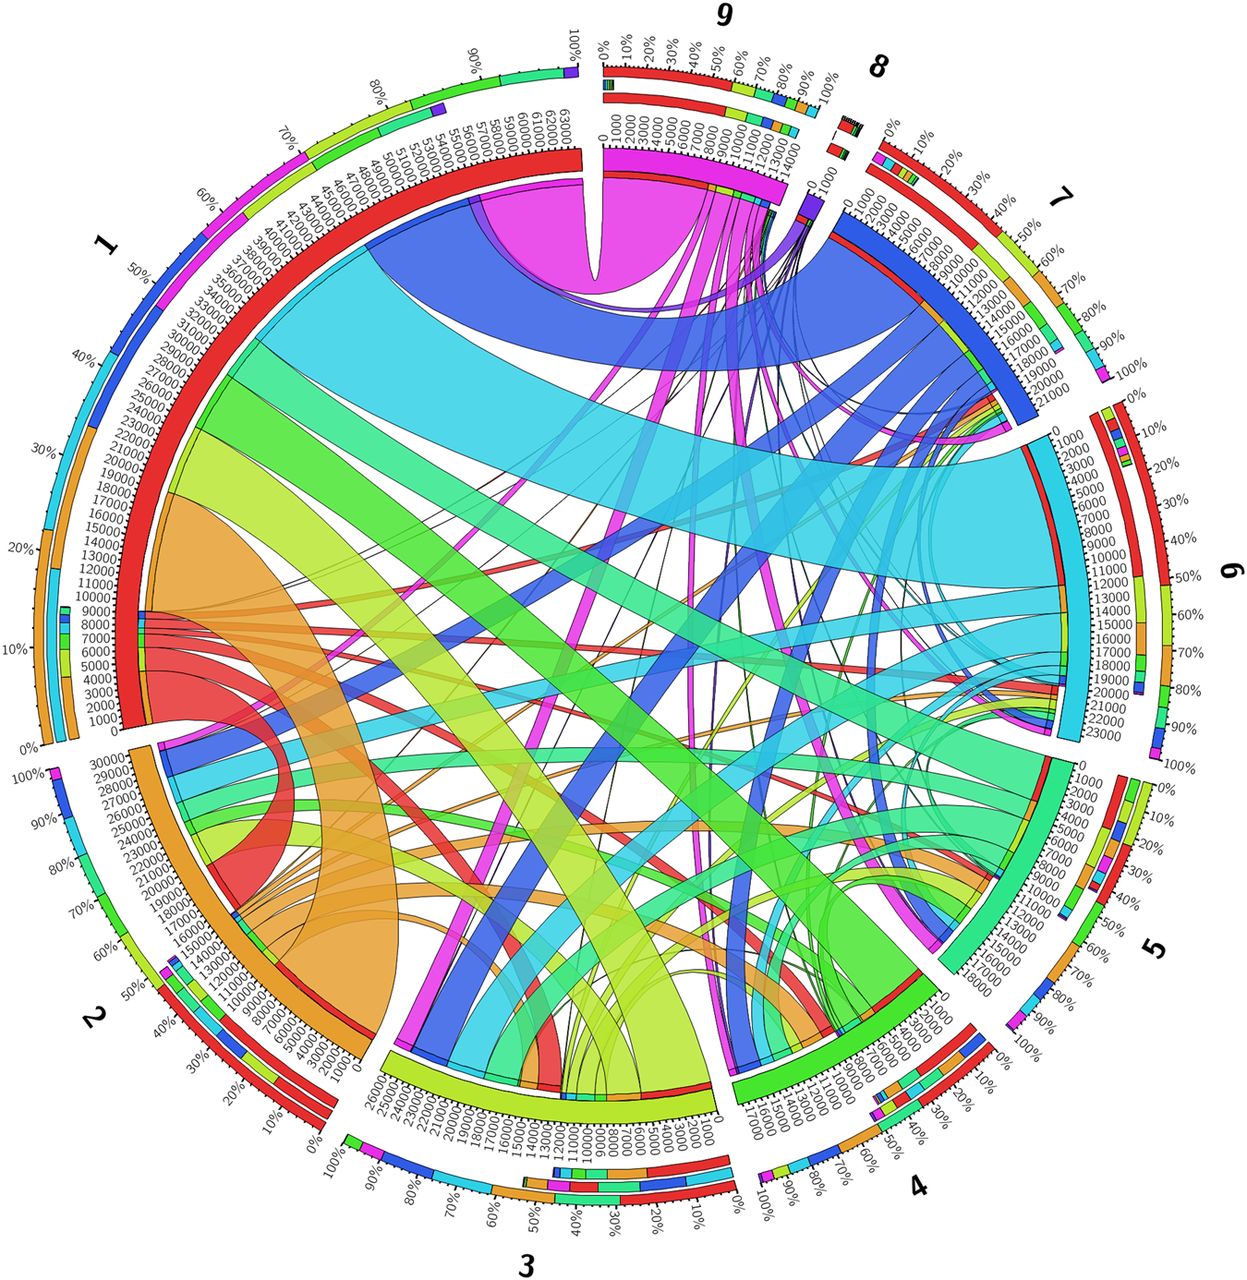
Chord diagram of the count of recombinant regions identified by fastGEAR between the clusters in the Burkina Faso N. meningitidis carriage collection. Clusters are positioned on the main circle of the diagram, with the arc length of the cluster indicating the number of recombination events. Linkages between clusters represent the number of recombinant regions occurring between those clusters with their width representing the number of regions and the color indicating the donating lineage. The three stacked bars outside the main diagram indicate, from outermost to innermost, the proportion of the total number of recombinant regions in each cluster colored by the other cluster involved, those same proportions only for the count of recombinant regions received, and those proportions for regions donated in the focal cluster.


