
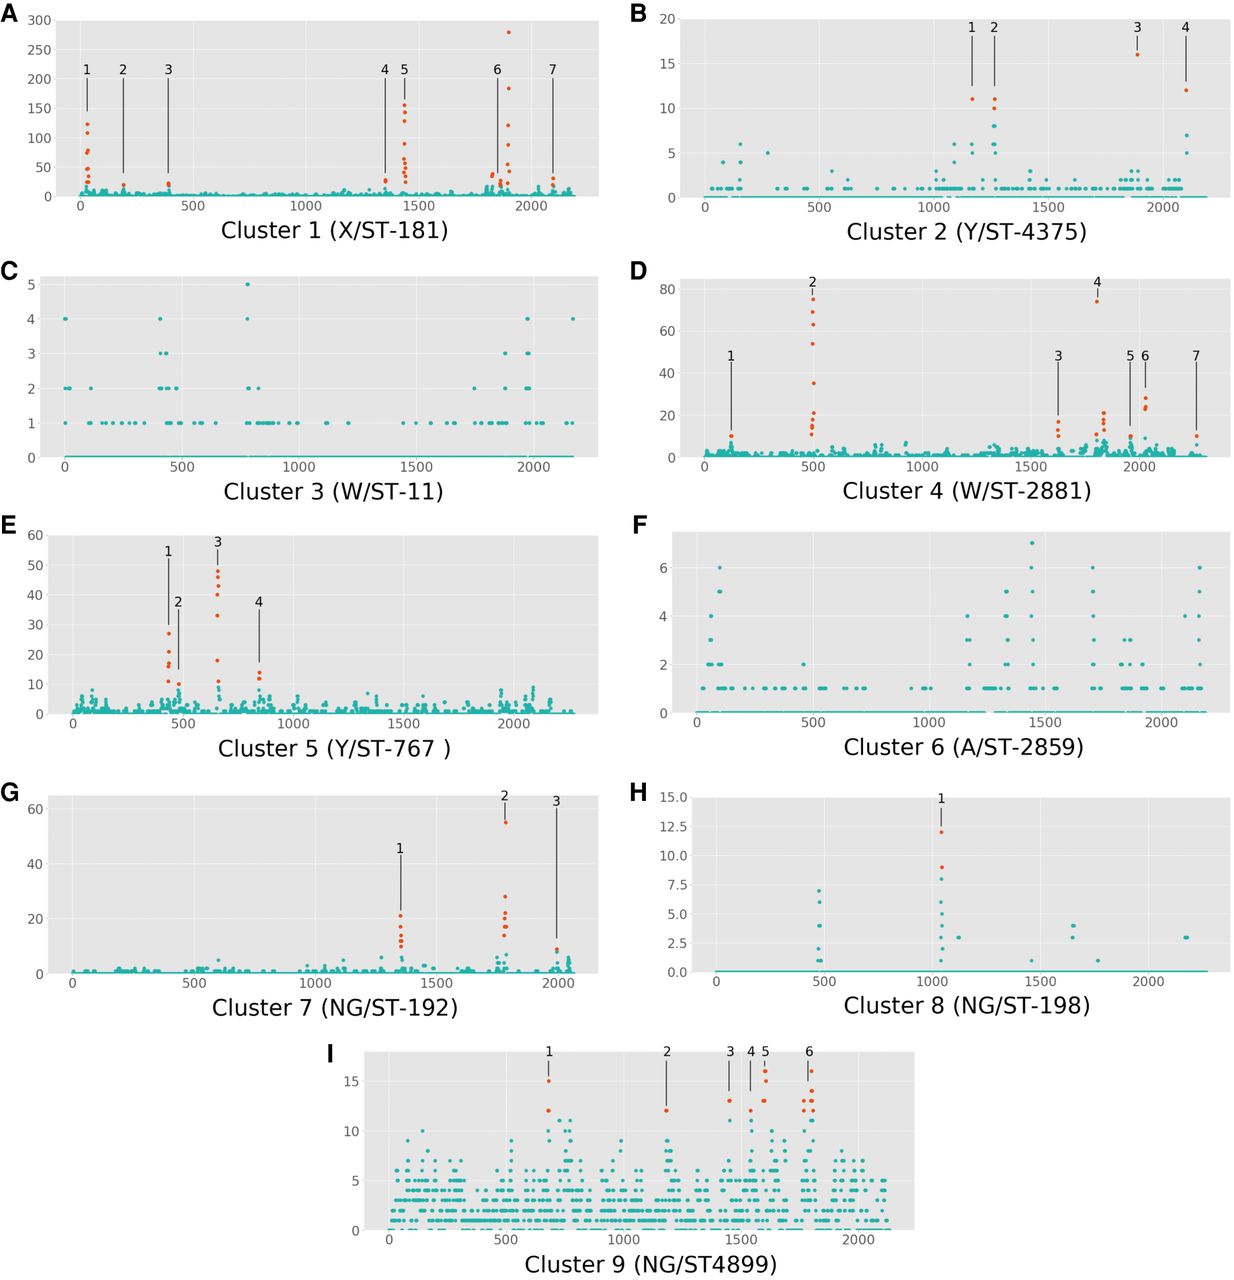
Figure 4.
Per-cluster Manhattan plots of the number of recombinations per discrete 1000-base pair window in each cluster's unique reference genome. Plots for Clusters 1–9 are in panels A–I, respectively. The number of recombinations in a window is indicated on the y-axis, and the position on the genome, in kilobases, is on the x-axis. Regions with elevated rates of recombination, determined manually based on obvious peaks in the plot, are highlighted in orange, and the genes within each numbered region are fully described in Table 2.


