
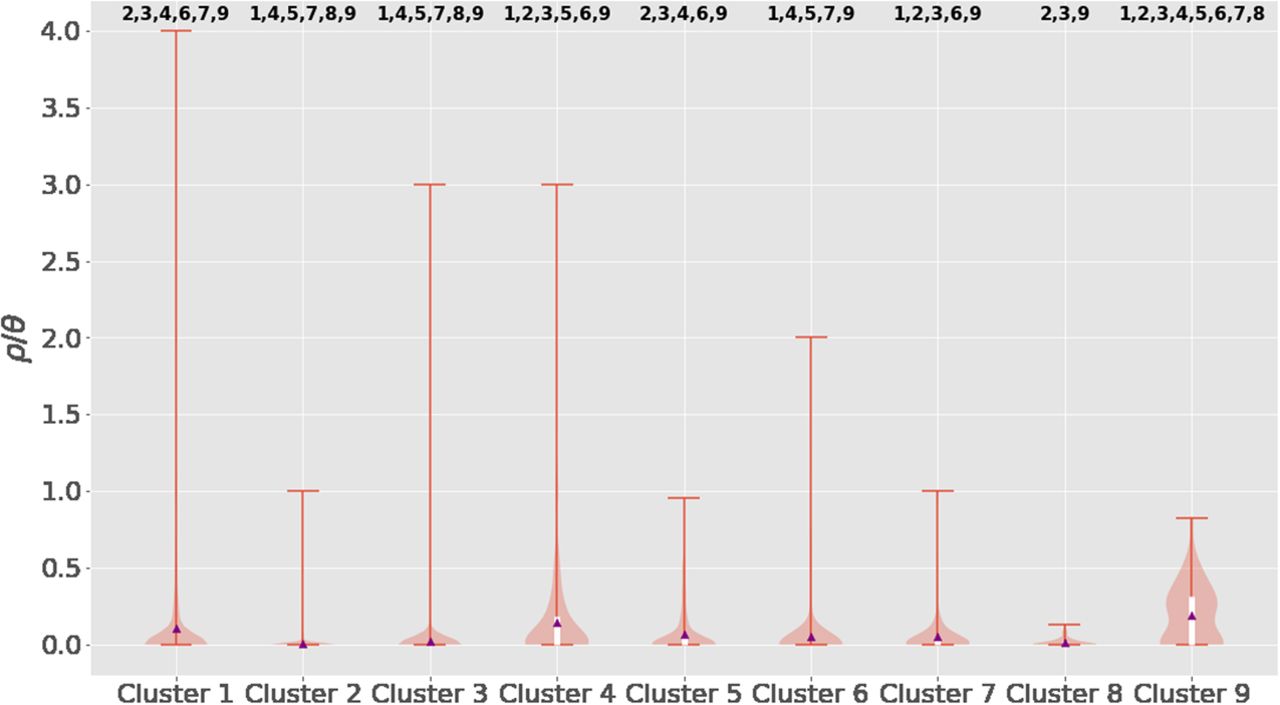
Violin plot of the per-isolate ρ/θ, recombination events per mutation event, as calculated by Gubbins for each cluster. The average ρ/θ per cluster is indicated by the purple triangles and these are also enumerated in Table 1. The top and bottom of the white boxes indicate the third and first quartiles, respectively, and the whiskers of the plot represent the maximum and minimum values. The orange background shading represents the distribution of inferred recombination rates within each cluster. Significant differences between clusters, as determined by a Kruskal–Wallis nonparametric analysis of variance on all the per-branch rates for each cluster, followed by post hoc statistical testing for differences between groups using Dunn's test and the conservative Holm-Bonferroni correction for multiple testing, is indicated by cluster numbers above each cluster's violin plot.


