
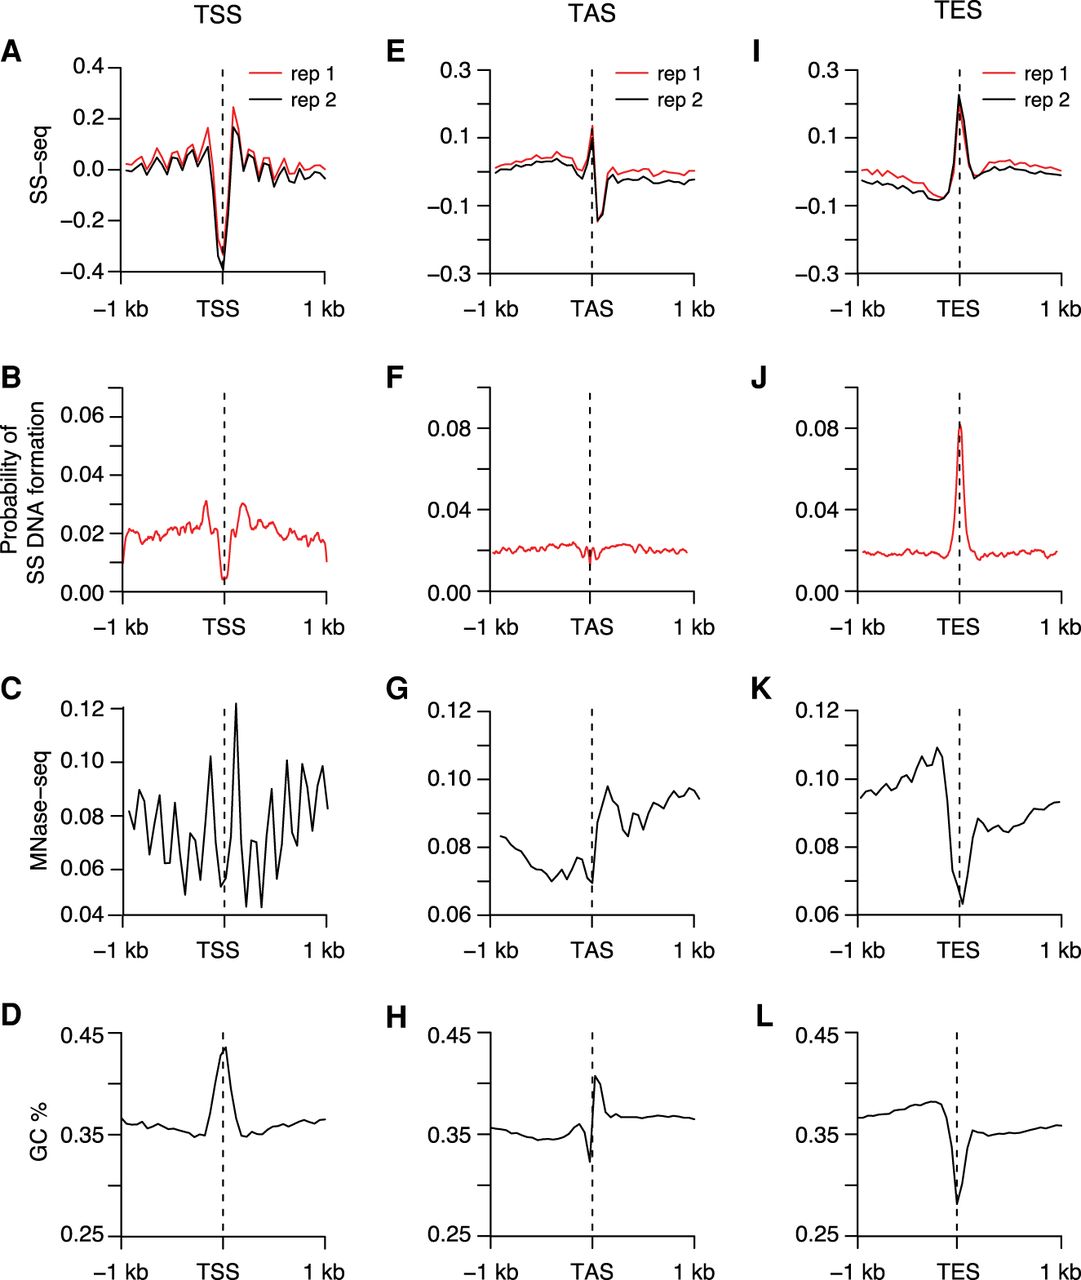
Figure 6.
SS DNA is a universal feature of TASs and TESs but not TSSs. (A,E,I) Average profiles of SS-seq in the 2-kb region around TSSs (A), TASs (E), and TESs (I) are plotted at 50-bp resolution. (B,F,J) Plots show average profiles of the SIST-predicted probability of strand separation in the 2-kb region surrounding TSSs (B), TASs (F), and TESs (J). (C,G,K) Plots of nucleosome profiles (MNase-seq) in the 2-kb region surrounding TSSs (C), TASs (G), and TESs (K) show that nucleosome positioning corresponds with SS DNA at TASs and TESs. (D,H,L) Average GC content is plotted in the 2-kb region around TSSs (D), TASs (H), and TESs (L) at 50-bp resolution.


