
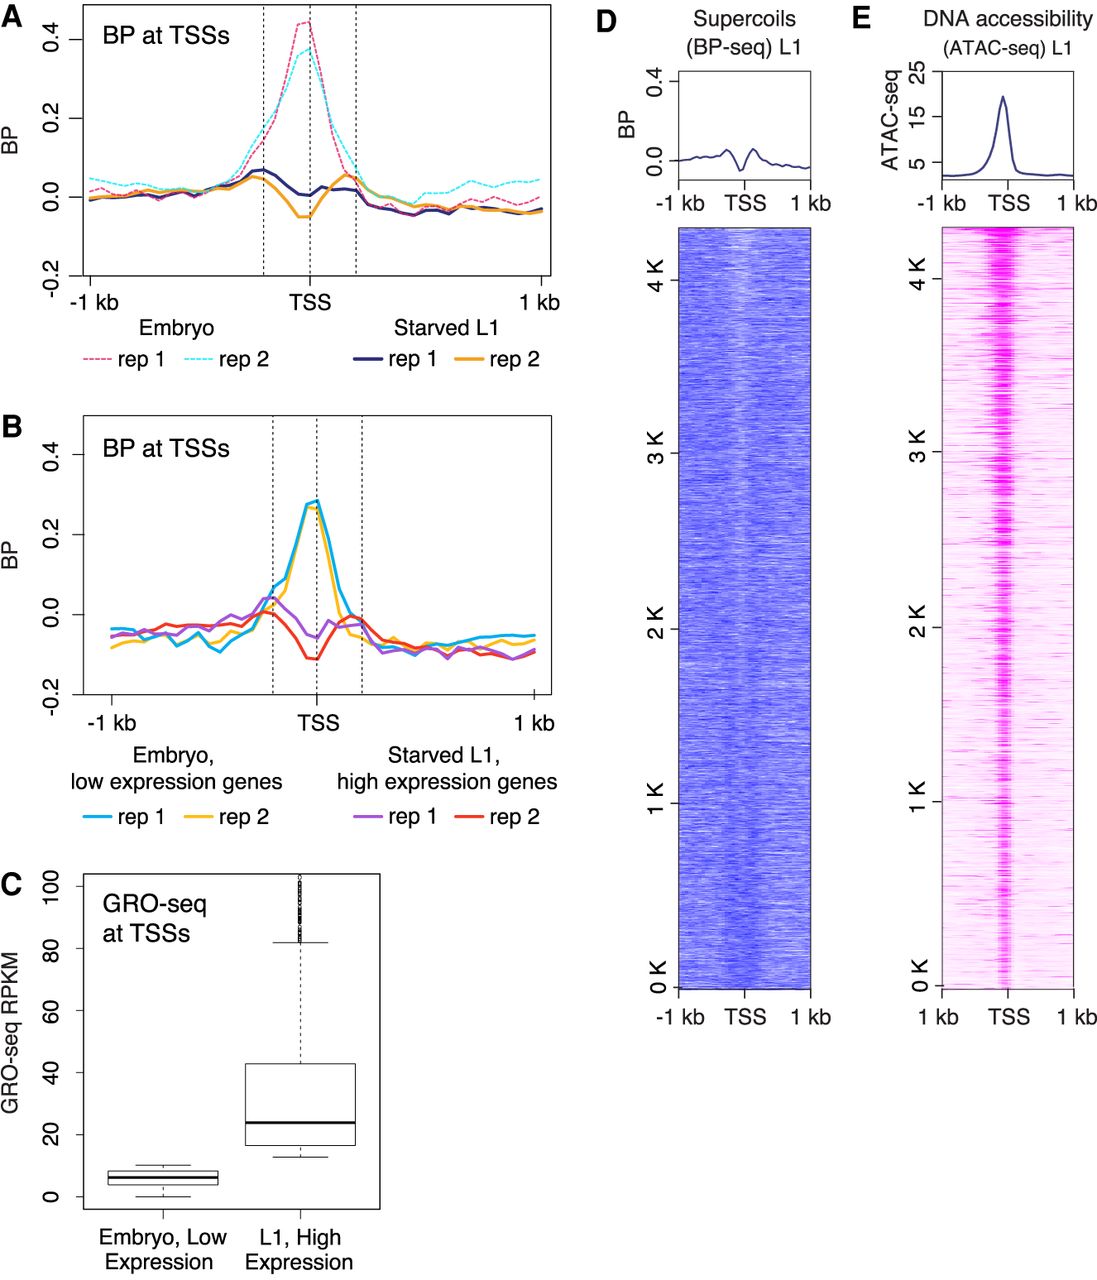
Developmental arrest through starvation decouples transcription and supercoiling at TSSs. (A) Average profiles of supercoils (BP-seq) are plotted in the 2-kb region surrounding TSSs at 50-bp resolution for starved L1s. For comparison, average profiles of supercoils (BP-seq) for embryos, as shown in Figure 1C, are presented as dashed lines. TSSs are from the 4221 highly expressed genes used in Figure 1C. (B) The reduction of negative supercoils in starved L1s does not correlate with reduction in transcription. Average profiles of supercoils (BP-seq) are plotted for genes with low expression in embryos and for genes with high expression in starved L1s. (C) Average GRO-seq counts in genes shown in B. (D) Heatmap of supercoils from BP-seq signal for starved L1s (replicate 1). (E) Heatmap of ATAC-seq at TSSs of starved L1s. TSS are sorted as shown in Figure 2A.


