
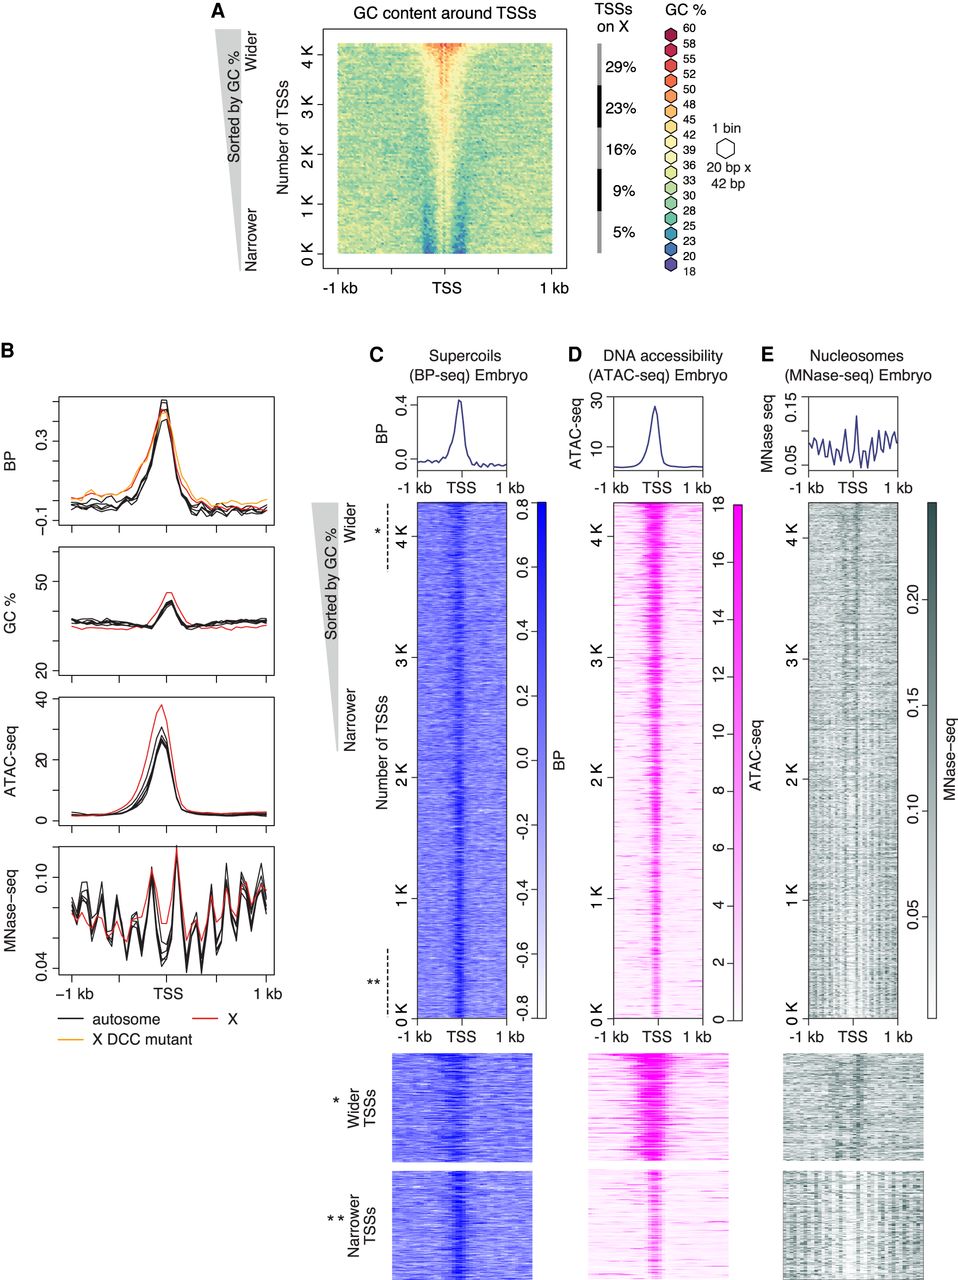
GC-rich regions flanked by sharp GC/AT transition delineate boundaries of supercoil propagation. (A) Heatmap of GC content in the 2-kb region around TSSs of 4221 highly expressed genes measured by GRO-seq (Kruesi et al. 2013). TSSs were sorted by GC content, and adjacent sequences were aligned on top of each other and binned (20 bp × 42 bp). Each bin is colored according to its GC percentage. (B–D) Comparison of profiles for supercoiling, chromatin accessibility, and nucleosome position around TSSs. Heatmaps of supercoils (BP-seq for wild-type embryo replicate 1; B), chromatin accessibility (ATAC-seq; C), and nucleosomes (MNase-seq; D) are plotted in the 2-kb region surrounding TSSs at 50-bp resolution. For B–D, TSSs are sorted by GC content as in A. Lower panels provide a magnified view of the top section (marked with one asterisk) and bottom section (marked with two asterisks) of corresponding heatmaps. (E) Average profiles of supercoils (BP-seq for wild-type embryo replicate 1 and DCC mutant replicate 1), DNA accessibility (ATAC-seq), and nucleosomes (MNase-seq) are plotted separately for the X Chromosome and each autosome in the 2-kb region around TSSs at 50-bp resolution. Averaged GC contents for X Chromosomes and autosomes are plotted separately.


