
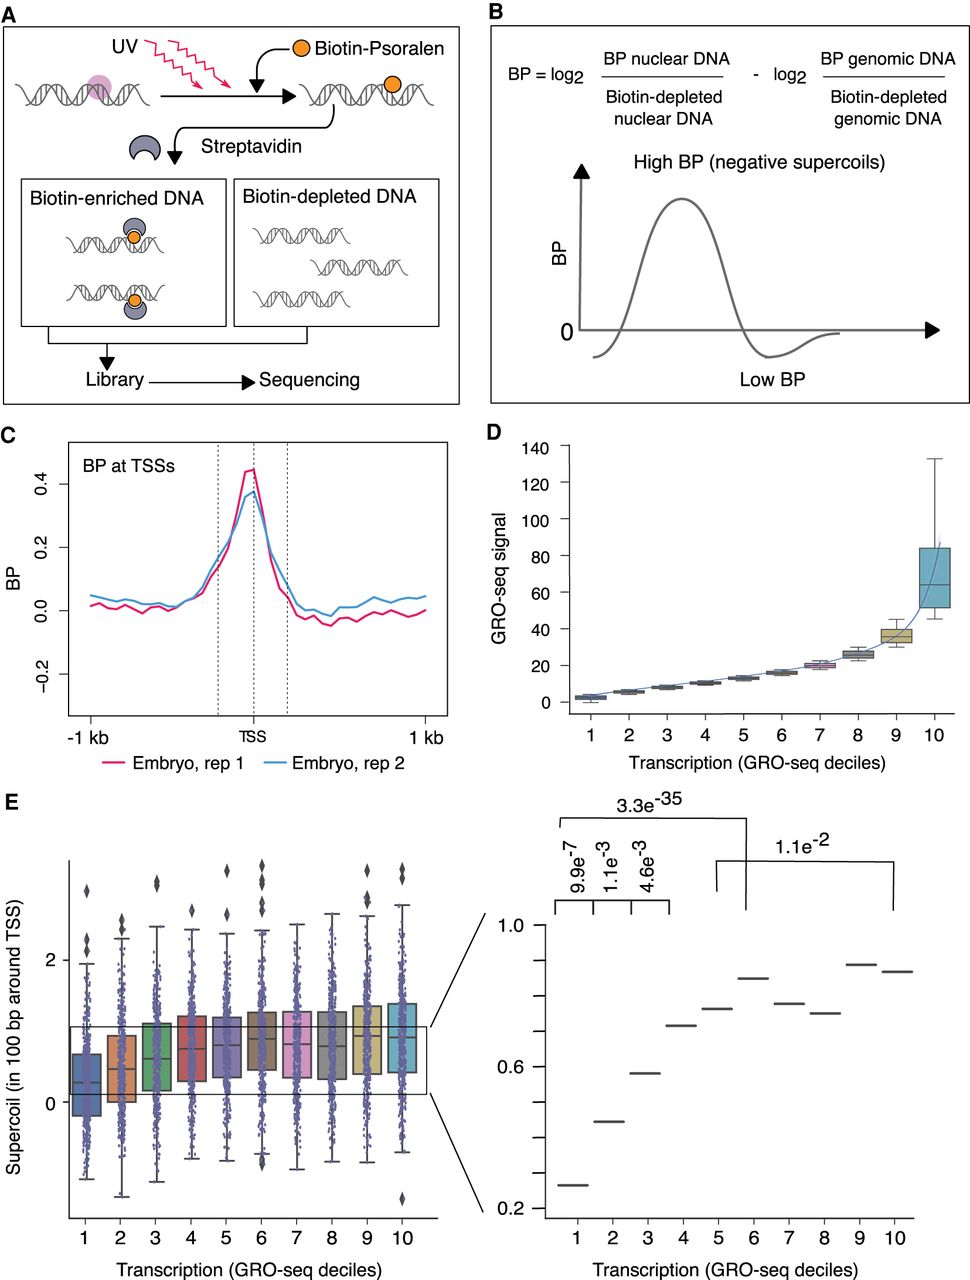
Genome-wide mapping strategy for DNA supercoils reveals negative supercoiling at transcription start sites (TSSs) of embryos. (A,B) Strategy for genome-wide mapping of DNA supercoils (BP-seq). (A) When biotinylated psoralen (BP) enters purified nuclei, it preferentially incorporates into negatively supercoiled DNA (purple circle). UV irradiation cross-links the intercalated BP to DNA. After DNA purification and sonication, BP-bound DNA is enriched on streptavidin beads. Libraries are prepared from both BP-enriched and BP-depleted samples and sequenced. As a control, naked genomic DNA is processed through the same steps. (B) The supercoiling profile is represented by the genomic distribution of the log2 ratio of BP-enriched over BP-depleted nuclear DNA adjusted by subtracting the log2 ratio of BP-enriched over BP-depleted naked genomic DNA. High signal corresponds to regions of negative supercoiling. (C) Average profiles of supercoils (BP-seq) are plotted in the 2-kb region surrounding TSSs of 4221 highly expressed genes (Kruesi et al. 2013) at 50-bp resolution for C. elegans embryos. Dashed lines represent locations of TSSs (center) and 200 bp upstream of (left) and downstream from (right) TSSs. (D) Box and whisker plots of GRO-seq values for 4221 genes after partitioning into deciles based on their average GRO-seq signal in the gene body. The lowest decile (decile 1) includes genes with the lowest 10% of GRO-seq values. A trend line through the medians of box plots for each decile shows a graded increase in GRO-seq values up to decile 6, followed by a much sharper ascent from decile 7 to 10. (E) Box and whisker plots of BP-seq signal in 100-bp intervals around TSSs correspond to the GRO-seq deciles shown in D. Magnified view of median values shows that BP signal scales with increases in transcription up to the sixth decile. From the seventh decile, a sharp ascent in GRO-seq values (D) does not correspond to a concomitant increase in BP values. P-values were calculated using the Mann–Whitney U test.


