
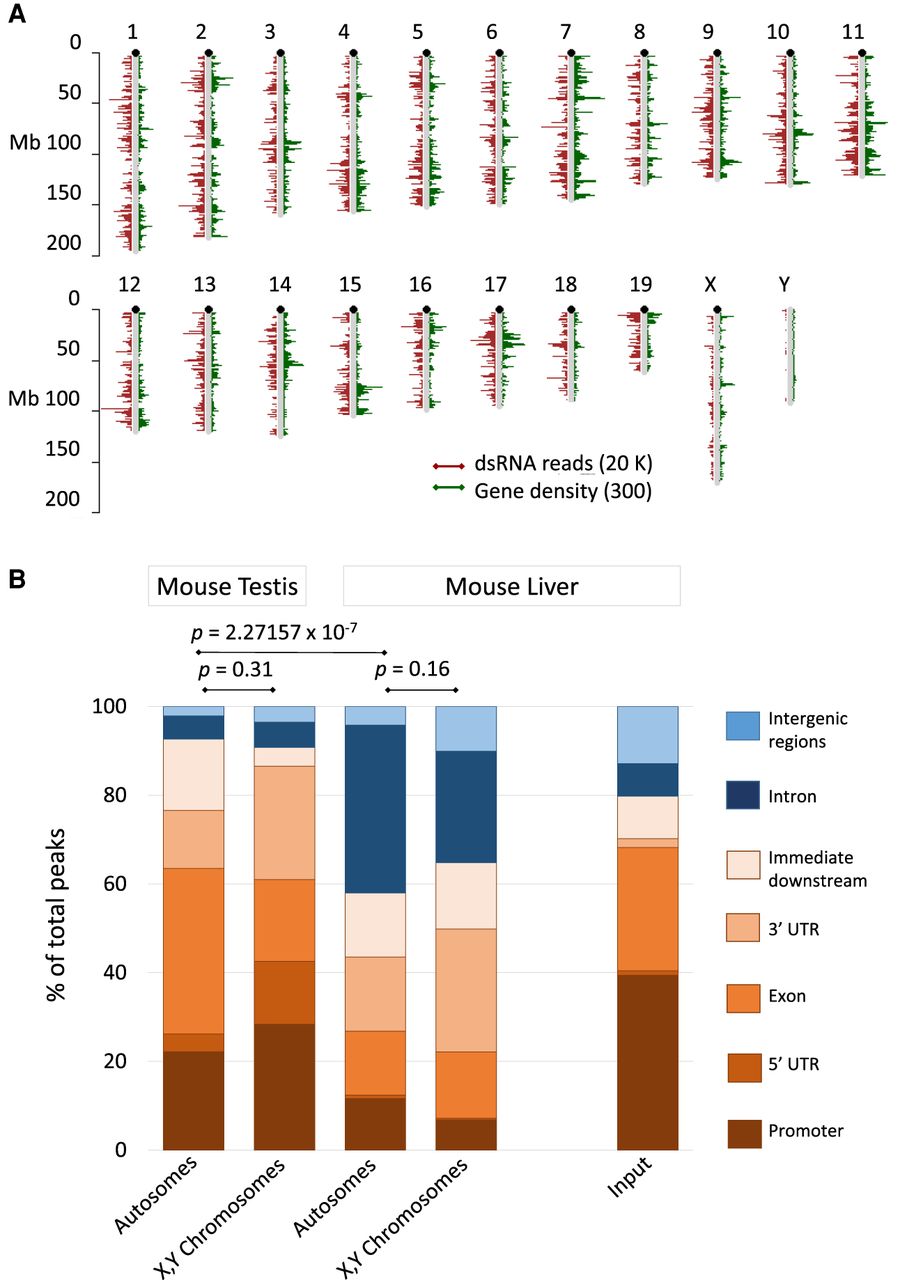
dsRNA transcriptome of combined mouse testis samples and liver. (A) Chromosomal distribution of dsRNA reads from testis. The dsRNA reads are in red; annotated protein-coding and noncoding genes in green are for comparison. dsRNA reads and genes show a comparable pattern. Sex chromosomes display less dsRNA compared to autosomes. The bars represent dsRNA read- or gene density per million bases. (B) J2 antibody enriched reads from mouse testis and liver were aligned and quantified; the input from mouse liver served as a control. The resulting peaks were then annotated to biotypes (color-coded as indicated) using ChIPpeakAnno. Features related to the regulation or the structure of annotated transcripts (promoters, exons, UTRs, and immediate downstream regions; GENCODE.vM20.annotation.gff3) are shaded in brown. Introns and intergenic regions are in shades of blue. Promoters encompass 1000 bp upstream of the transcription start; “immediate downstream” includes 1000 bp downstream from the transcript end. Autosomes and sex chromosomes are displayed in separate columns because sex chromosomes are enriched in repetitive elements and depleted in natural antisense transcripts, both of which are associated with dsRNA formation. The pipeline is described in the Methods and graphically outlined in Supplemental Figure S1.


