
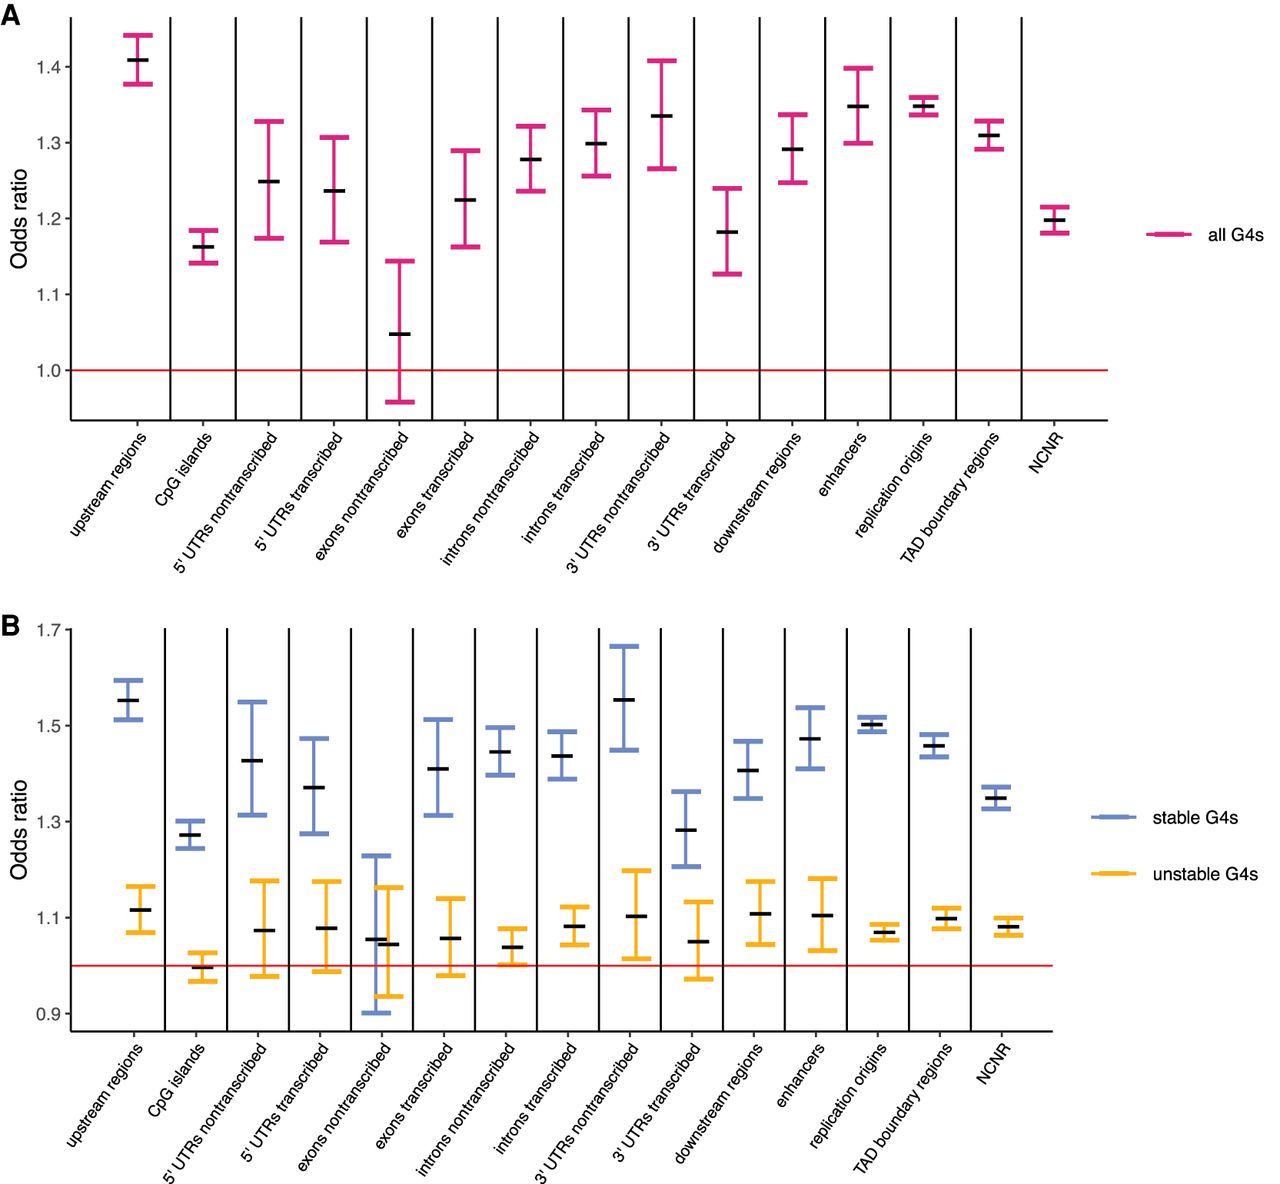
Figure 4.
Odds ratios (and their 95% confidence intervals) of the Fisher's exact test used to evaluate the significance of the Hudson–Kreitman–Aquadé test used to evaluate selection acting on G4 loci located at genic components and nongenic functional regions. Stable and unstable G4 loci are considered together (A) and separately (B). Red line represents an expectation under a null hypothesis of similar selective pressure acting on G4 loci and on the remaining sequences at the components/regions they are located within. If confidence intervals do not overlap the red line, the test is significant. Sample sizes are shown in Supplemental Table S1.


