
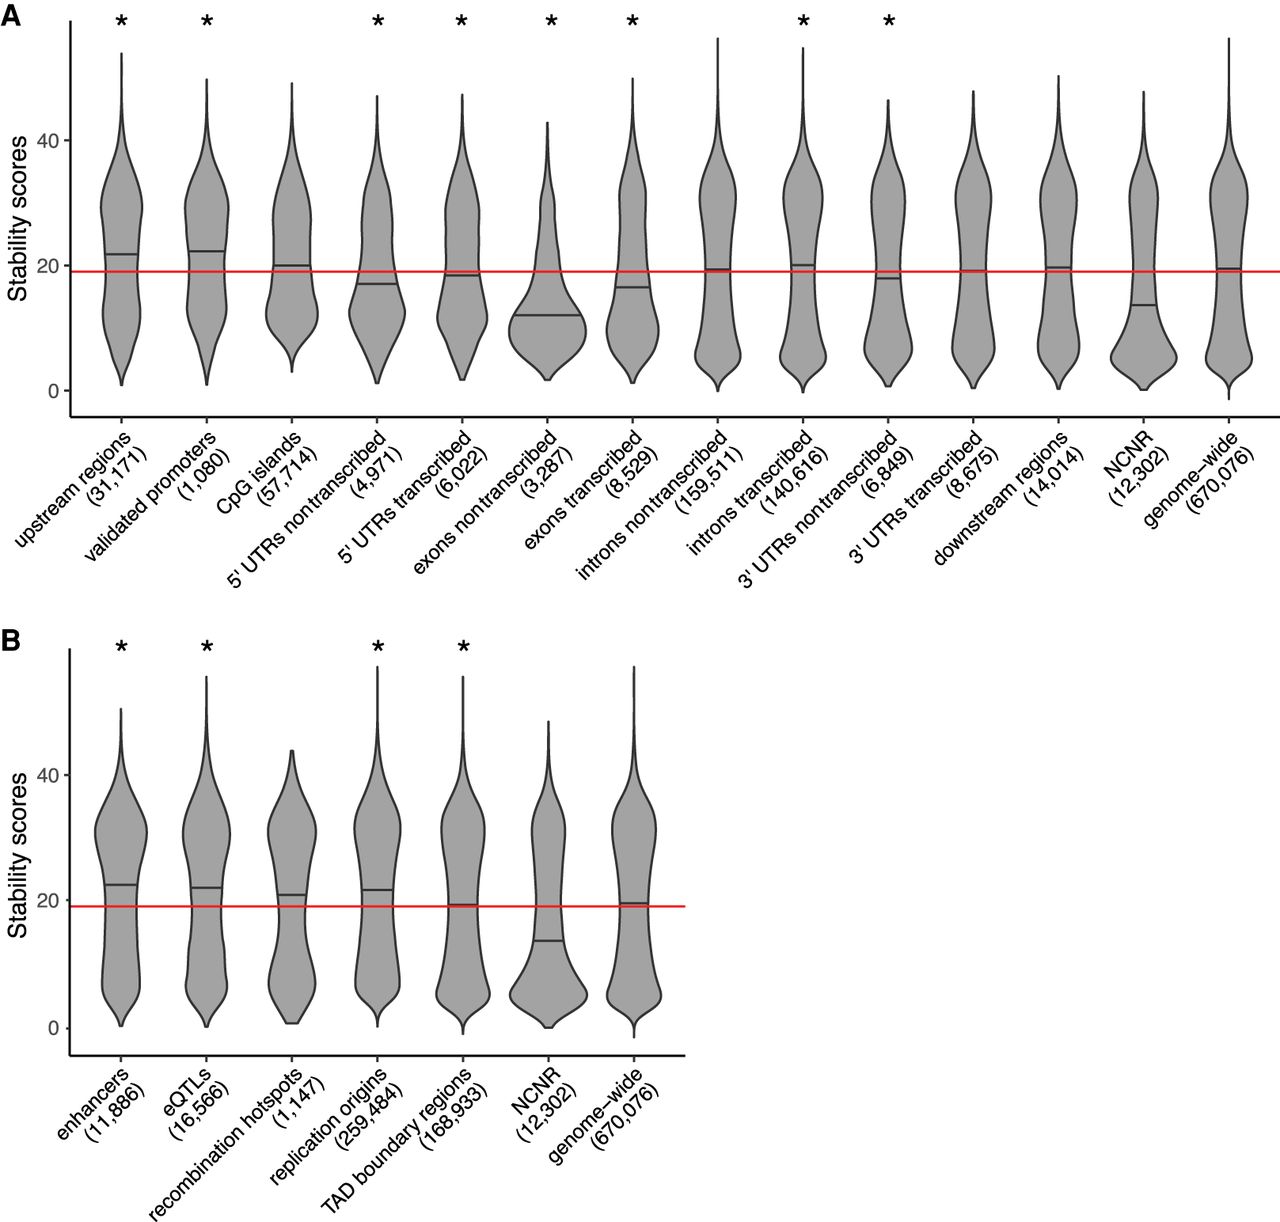
Distribution of stability scores (violin plots) at G4 loci located at different genic components (A) and nongenic functional regions (B) compared with the genome-wide distribution and with the distribution in the NCNR subgenome. Stability scores were obtained with the Quadron software (Sahakyan et al. 2017a). Median values are marked on the violin plots. The number of G4 loci contained completely within components or regions (Supplemental Table S1) is shown in the parentheses. Because eQTLs are always smaller than G4 loci, we plotted the scores of G4 loci only partially intersecting with eQTLs. Red horizontal line indicates stability score of 19 used to differentiate between stable (more than 19) and unstable (19 or fewer) G4 loci. Stars indicate a significant difference between median stability scores in a group of components or regions and that in the rest of the genome.


