
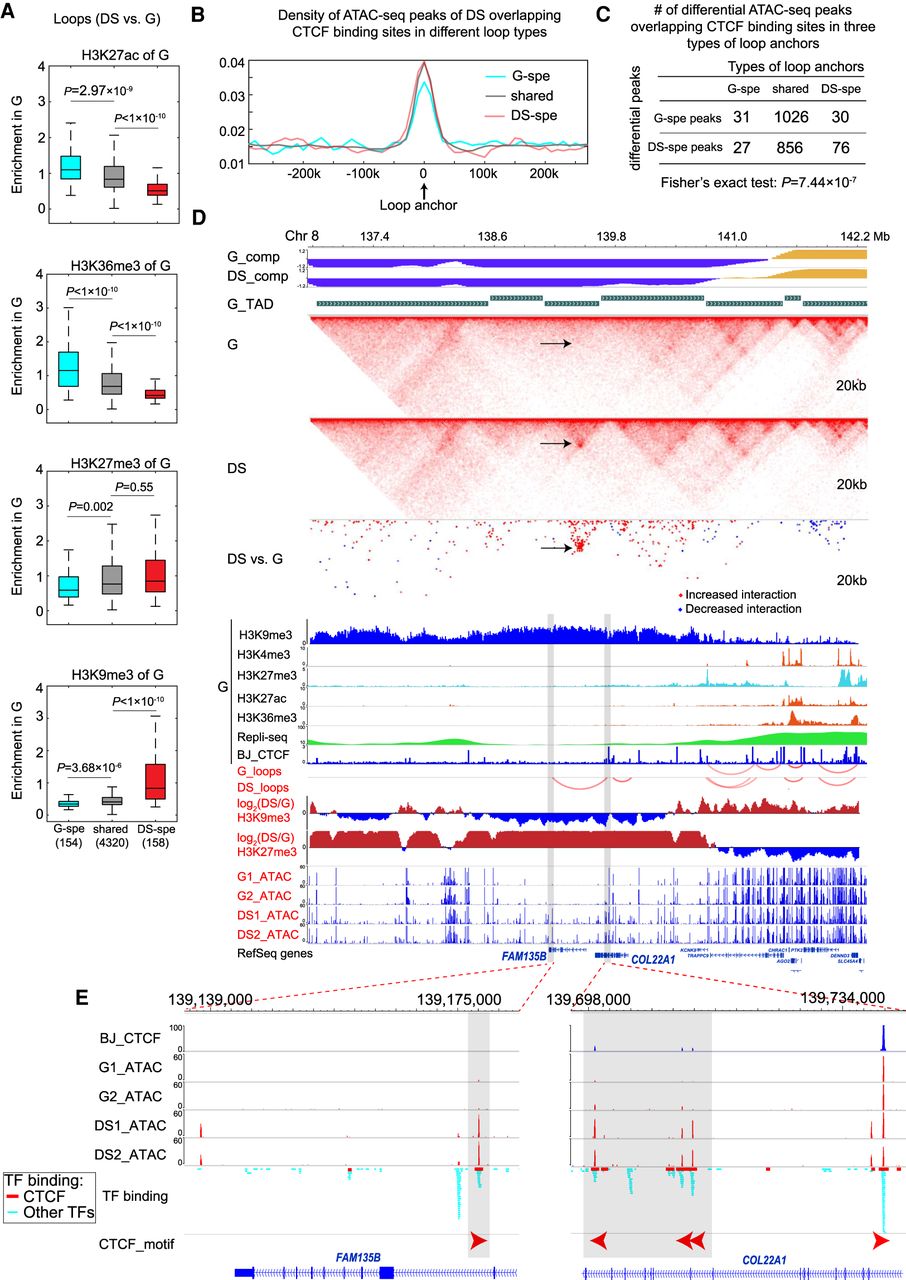
Novel looping within heterochromatin of G during senescence. (A) Box plots of histone modification enrichments of G for G-specific, DS-specific, and shared loops. The y-axis is the average enrichment of histone modifications of G for genomic regions between two loop anchors. The numbers of loops for three categories are listed in the bottom. (B) The aggregated plots of ATAC-seq peak density of DS around loop anchors. (C) The numbers of differential ATAC-seq peaks overlapping CTCF binding sites in anchors of different loop types. We called differential ATAC-seq peaks in DS versus G and calculated the numbers of peaks residing in anchors of three different loop types. DS-specific loops occupy significantly more DS-specific peaks than G-specific peaks. (D) WashU Epigenome Browser view of novel looping during senescence. Tracks include compartment scores, TAD, normalized interactions of G and DS, differential interactions between G and DS (red indicates increased interactions in DS and blue indicates decreased interactions in DS), histone modifications, loops, and ATAC-seq signals. (E) Zoomed-in view of two anchors of the novel loop. The orientations of CTCF motifs are labeled. Novel peaks overlapping potential CTCF binding sites within loop anchors are established in DS.


