
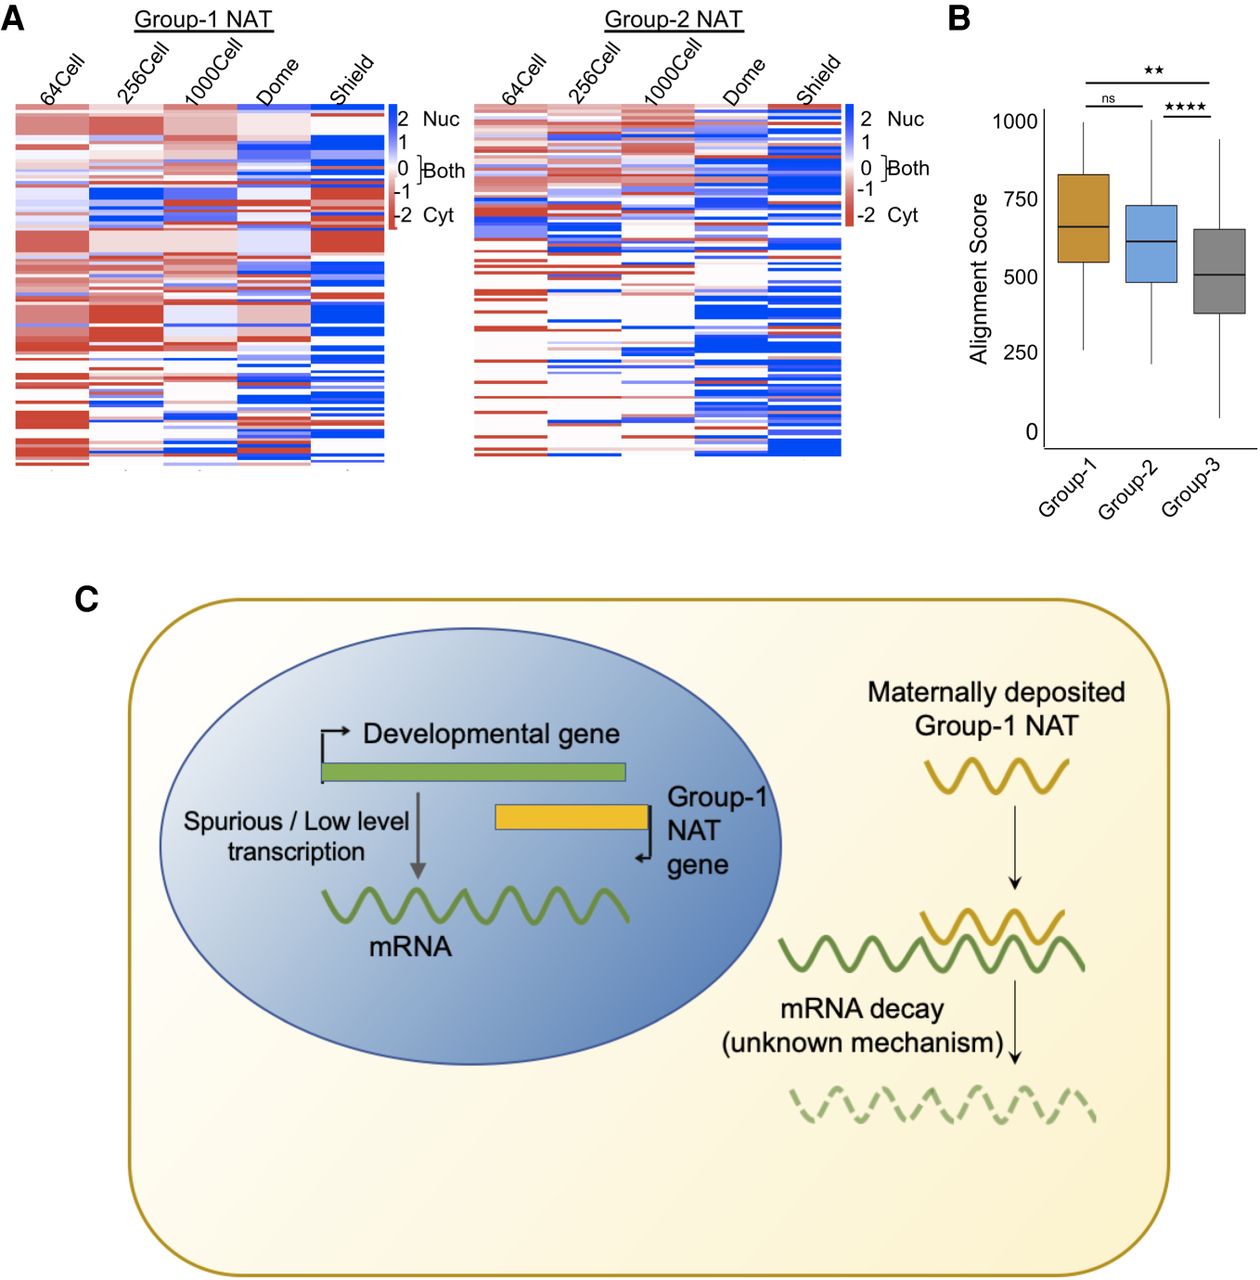
Localization of NATs during zebrafish development. (A) Heatmaps showing the localization of Group 1 and Group 2 NATs during zebrafish development. The scales are from −2 (red, cytosolic) to 2 (blue, nuclear) and 0 (white, both). (B) A box plot of the alignment score between NATs and overlapping mRNA sequence in Group 1 (yellow), Group 2 (blue), and Group 3 (gray). Each box shows the median value (as horizontal lines) and extends from the 25th to 75th percentile values for each group. The outliers are shown as dots. The significance values are as follows: (**) P < 0.005; (****) P < 0.0001; (ns) nonsignificant (unpaired, two-tailed t-test). (C) A schematic model showing probable mechanism of Group 1 NATs in down-regulating developmental genes.


