
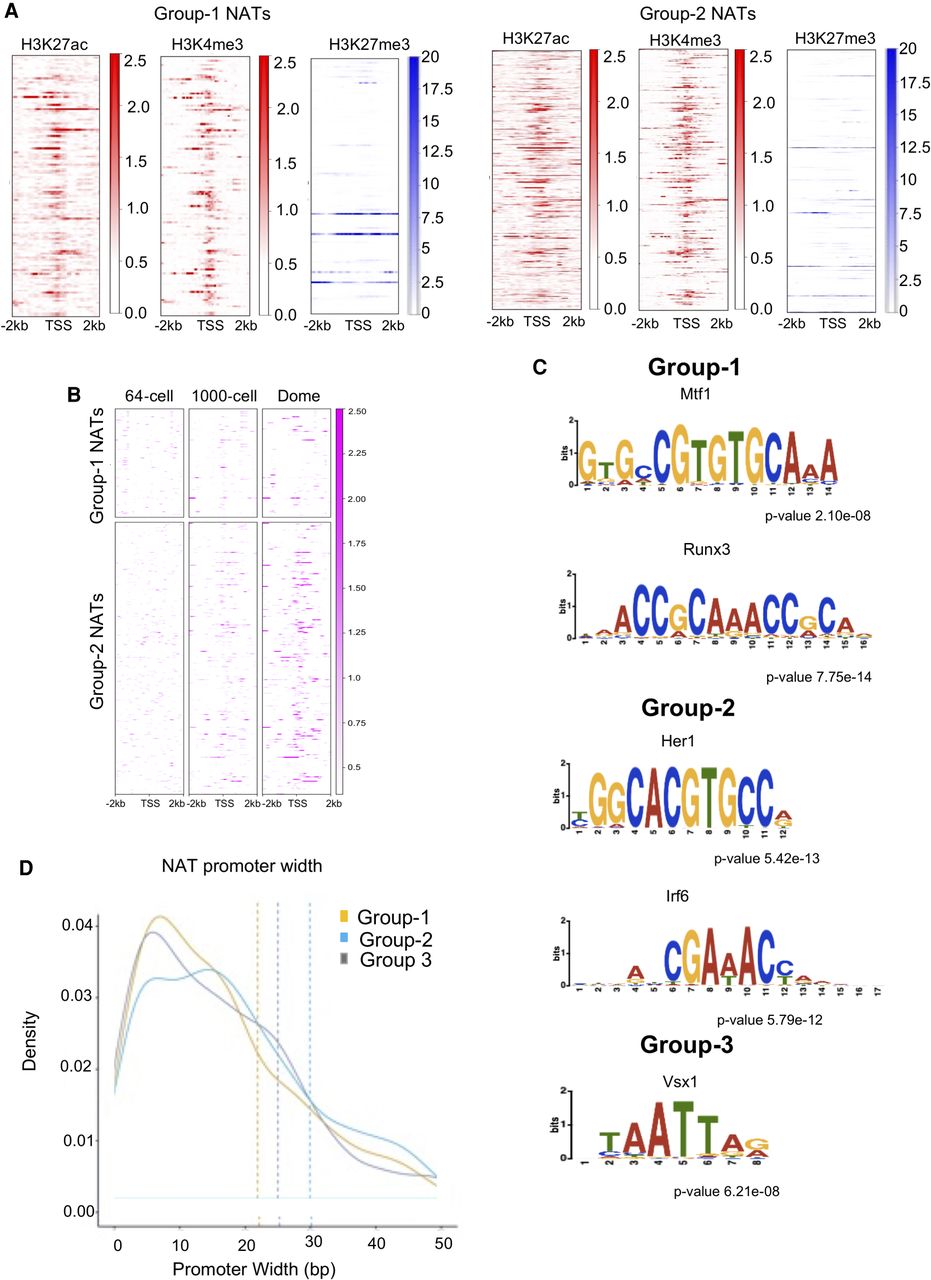
Figure 5.
Analysis of transcription regulation of NATs in the three different categories. (A) Heatmaps displaying the distribution of ChIP-seq reads for H3K27ac (red), H3K4me3 (red), and H3K27me3 (blue) histone modifications across the TSS of Group 1 and Group 2 NATs. (B) Heatmaps of the distribution of ATAC-seq reads displaying the open chromatin at the TSS of Group 1 and Group 2 NATs. (C) The different motifs associated within the promoters of Group 1, Group 2, and Group 3 NATs. (D) Promoter width (x-axis) distribution of the NATs in the three groups.


