
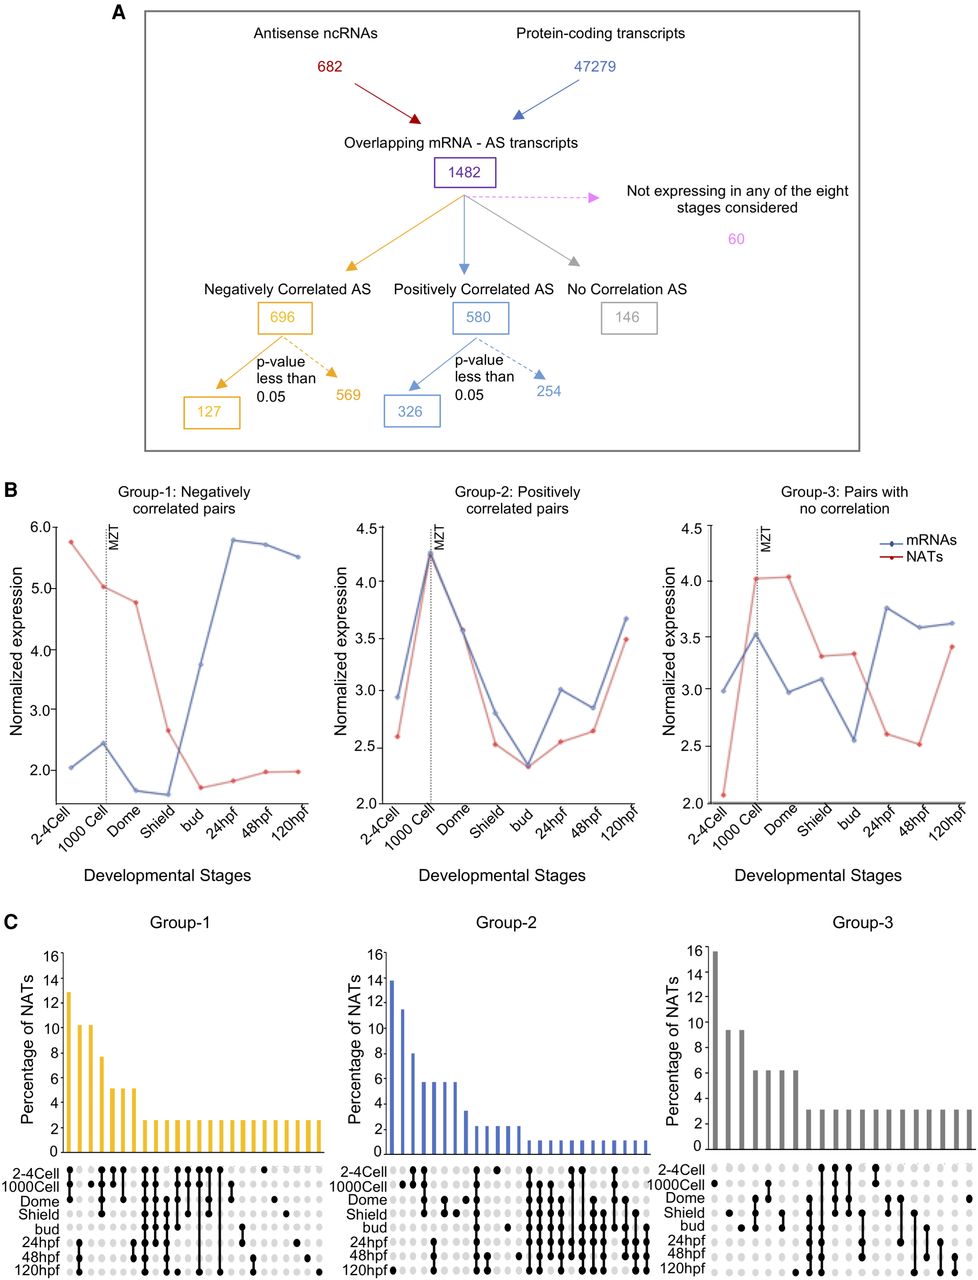
Distinct classes of NATs during zebrafish development. (A) Overview of the pipeline undertaken to identify and categorize the NATs based on their expression correlation with overlapping mRNAs. There are 127 anti-correlated (Group 1), 326 positively correlated (Group 2), and 146 no correlation (Group 3) NAT–mRNA pairs. (B) Line plots showing the average abundance of NATs and overlapping mRNAs in the three categories (negatively correlated, positively correlated, and no correlation) during development. (C) UpSet plots illustrating the frequency of NATs in the negatively correlated Group 1 (yellow), positively correlated Group 2 (blue), and no correlation Group 3 (gray) that are common or unique during zebrafish development. Filled circles represent the stages under consideration for the bar above.


