
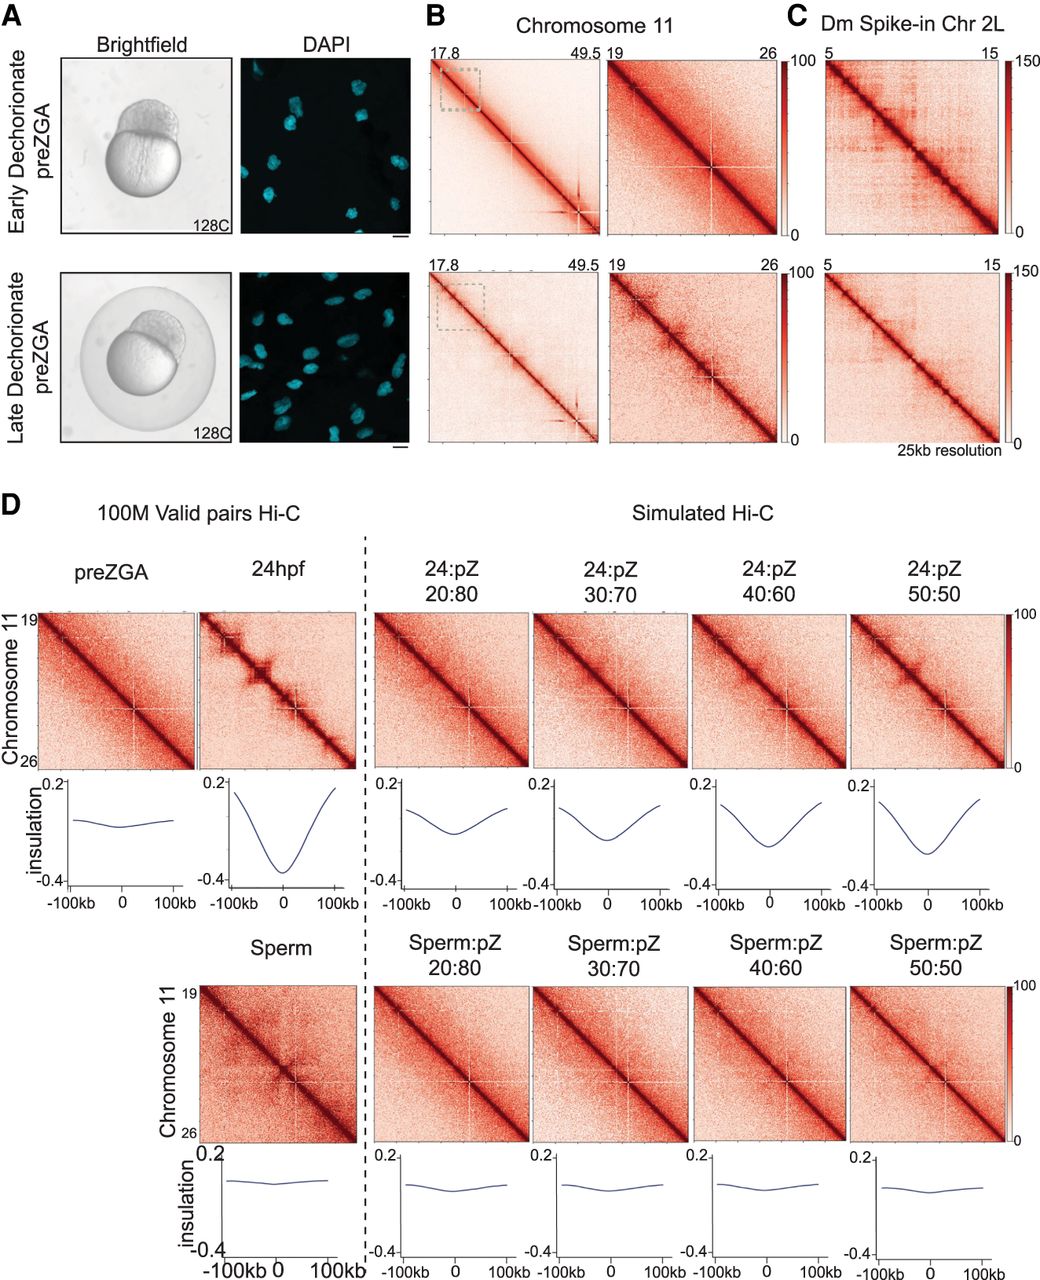
Impact of alternative chorion removal procedures on perceived chromatin architecture. (A) Brightfield images of embryos collected at pre-ZGA/128-cell: early dechorionated (at 128-cell stage; top left), late dechorionated (just before fixation; bottom left). pre-ZGA/128-cell embryo fixed and the DNA was stained with DAPI (cyan) dechorionated at one-cell stage (top right) and dechorionated before fixation (bottom right) with 40× obj scale bar = 10 µM. (B) Contact matrices from pre-ZGA/128-cell, whole Chromosome 11 (early dechorionated, top left; late dechorionated, bottom left) inlet is marked in dashed gray box; partial Chr 11: 19–26 Mb (early dechorionated, top right; late dechorionated, bottom right), 25-kb resolution in log scale. (C) Contact matrices from the Drosophila S2 spike-in, Chr 2L: 5–15 Mb (early dechorionated, top; late dechorionated, bottom), 25-kb resolution in log scale. (D) Contact matrices from Chr 11: 19–26 Mb pre-ZGA/128-cell, 24 hpf, and sperm down-sampled to 100 M valid pairs (left of dashed line). Simulated contact matrices (right of dashed line) are imaged of pre-ZGA/128-cell with increasing percentages of 24 hpf (top) or sperm (bottom) valid pairs. Metaplots for the boundaries called at 24 hpf (25-kb resolution) are plotted below each matrix.


