
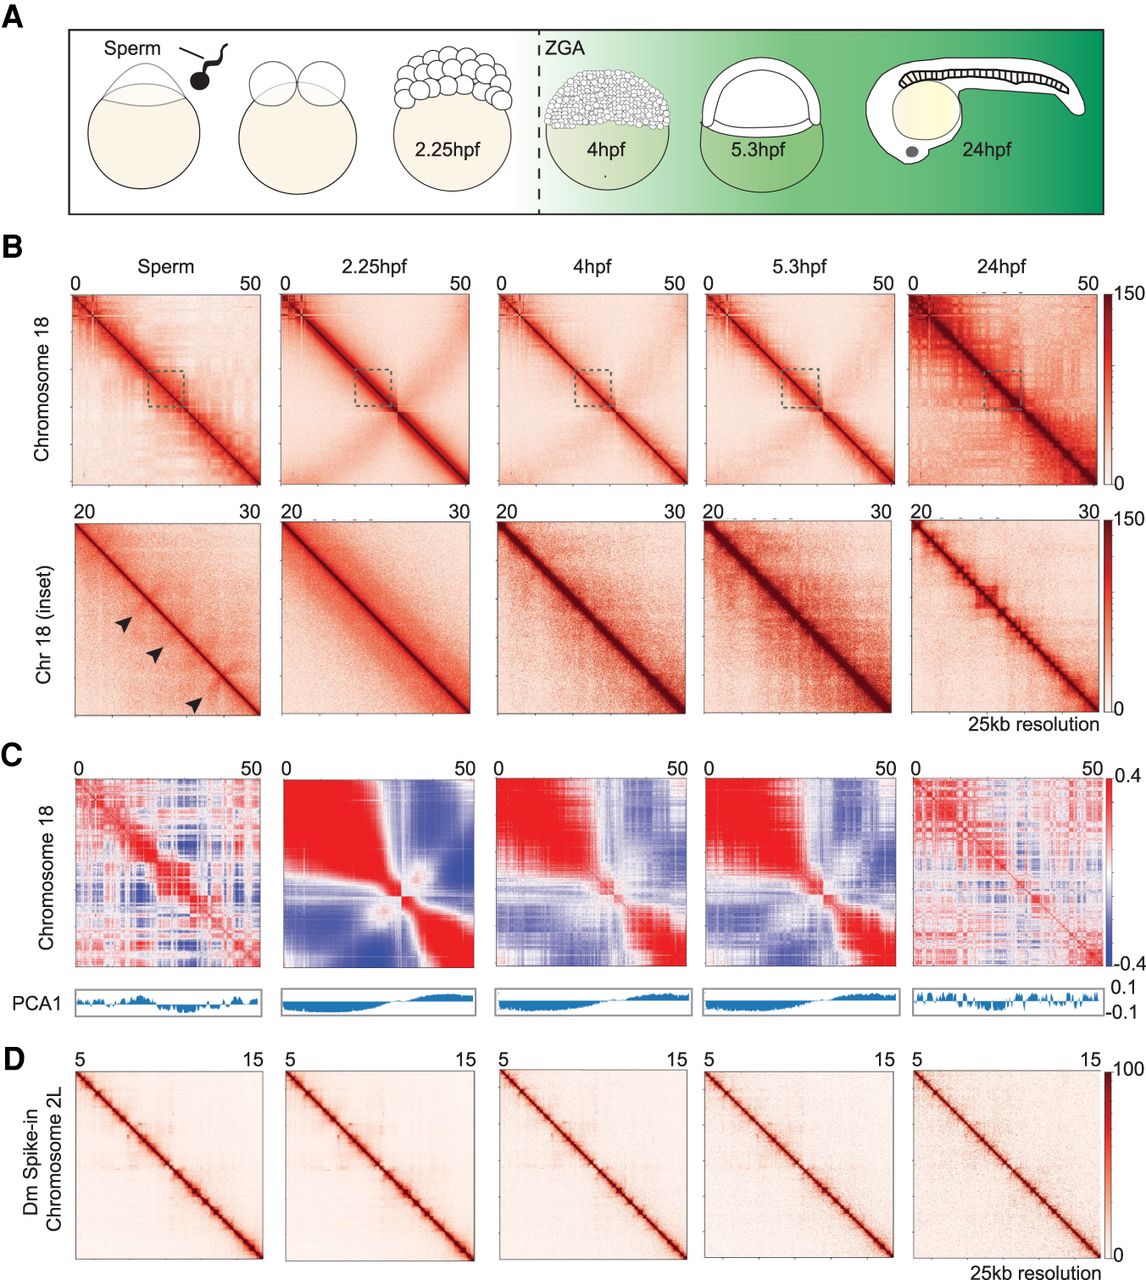
Chromatin architecture in the developing zebrafish sperm and embryos. (A) Schematic of the time points collected. Samples collected for low-cell in situ Hi-C experiments: sperm, 2.25 hpf (pre-ZGA, 128-cell), 4 hpf, 5.3 hpf, and 24 hpf. The onset of transcription during zygotic genome activation (ZGA) is ∼3 hpf in zebrafish. The transcription activity is portrayed by the green background. (B) Contact matrices of each time point from Chromosome 18 (top) inlet is marked in dashed gray box; Chr 18: 20–30 Mb (bottom), 25 kb resolution in log scale. Flares detected in sperm time point are marked by black arrows. (C) Correlation matrix of each time point from Chr 18. The first eigenvector (PCA1) for the normalized observed/expected ratio is shown below the panel to determine A/B compartment status. (D) Contact matrices of each time point from the Drosophila S2 spike-in Chr 2L: 5–15 Mb, 25 kb resolution in log scale.


