
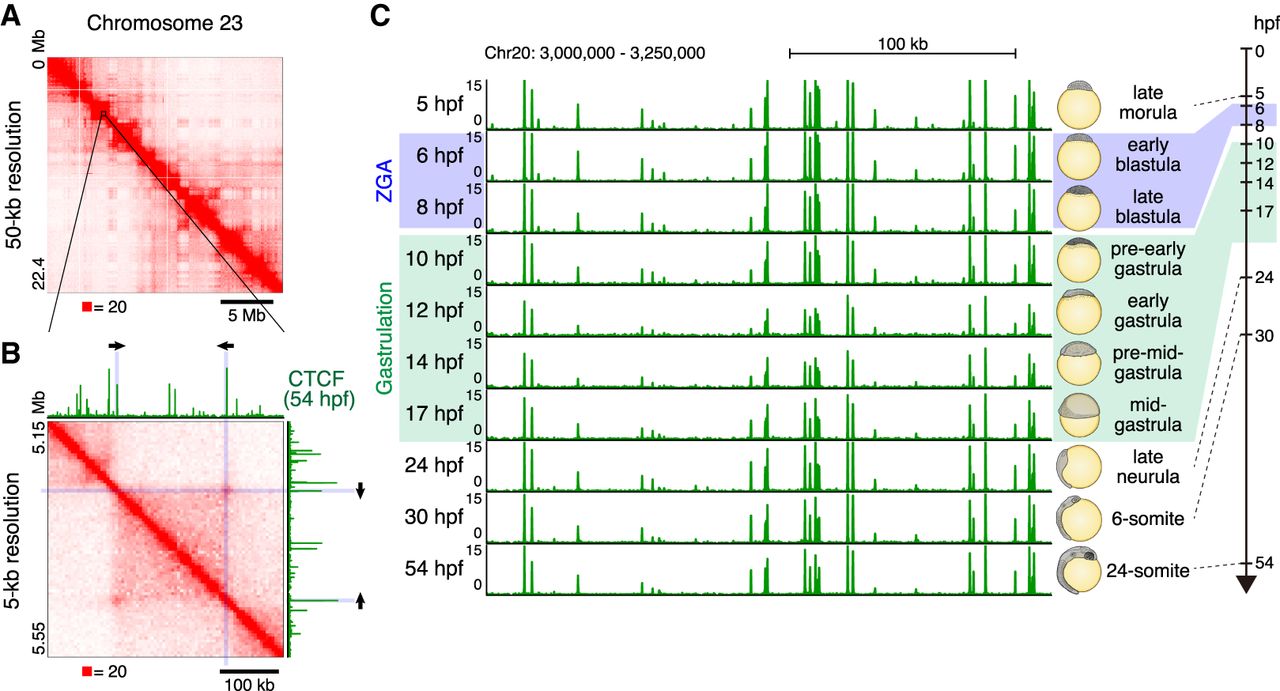
Figure 1.
3D genome structure of medaka fibroblast cells and CTCF positioning throughout medaka development. (A) Hi-C contact map of medaka fibroblast cells. Normalized observed Hi-C contacts are shown as a heat map. Whole Chromosome 23 at 50-kb resolution shows plaid pattern. (B) Zoomed view of Chromosome 23 Hi-C contact map at 5-kb resolution and CTCF ChIP-seq track from 54-hpf embryos are shown. Arrows indicate the orientation of CTCF binding motifs within CTCF ChIP-seq peak at the loop anchor position. (C) CTCF positioning is stable throughout medaka development; representative view of CTCF ChIP-seq tracks across the developmental stages.


