
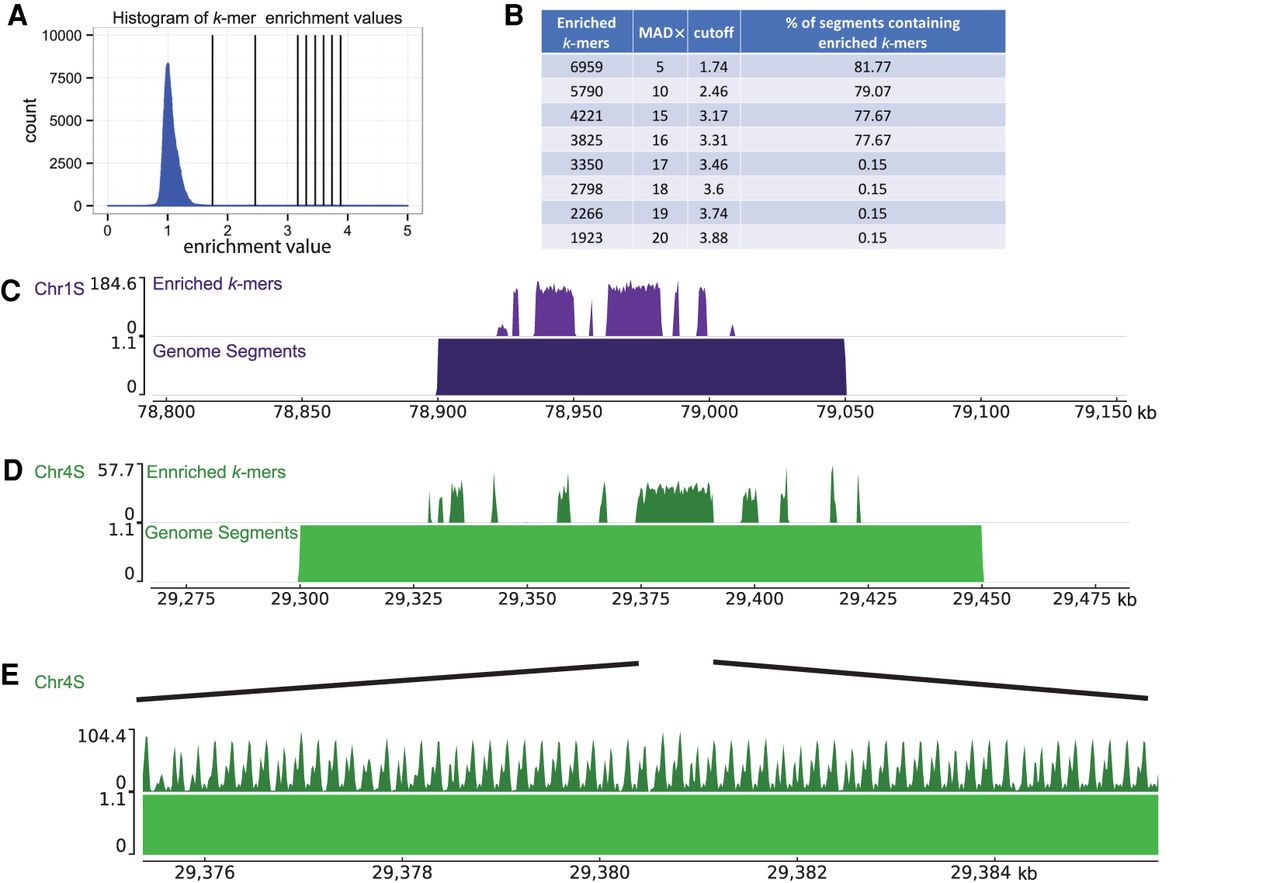
Identification of centromeres on Xenopus laevis chromosomes. (A) Histogram of centromere enrichment scores for 25-bp k-mers. Enrichment scores are the ratio of normalized k-mer counts for the Cenpa data set over the input data set. Vertical lines display stringency cutoffs of (1, 2, 5, 10, 15, and 20) median absolute deviations away from the median enrichment value. (B) Table displaying the number of enriched 25-bp k-mers, the median absolute deviations (MAD×) away from the median used as the cutoff value, the enrichment value cutoff, and the percentage of genome segments containing an enriched k-mer. (C–E) Representative genome browser images with aligned enriched k-mers (top) and aligned genome segments (bottom). E is a zoom-in on a region in D.


