
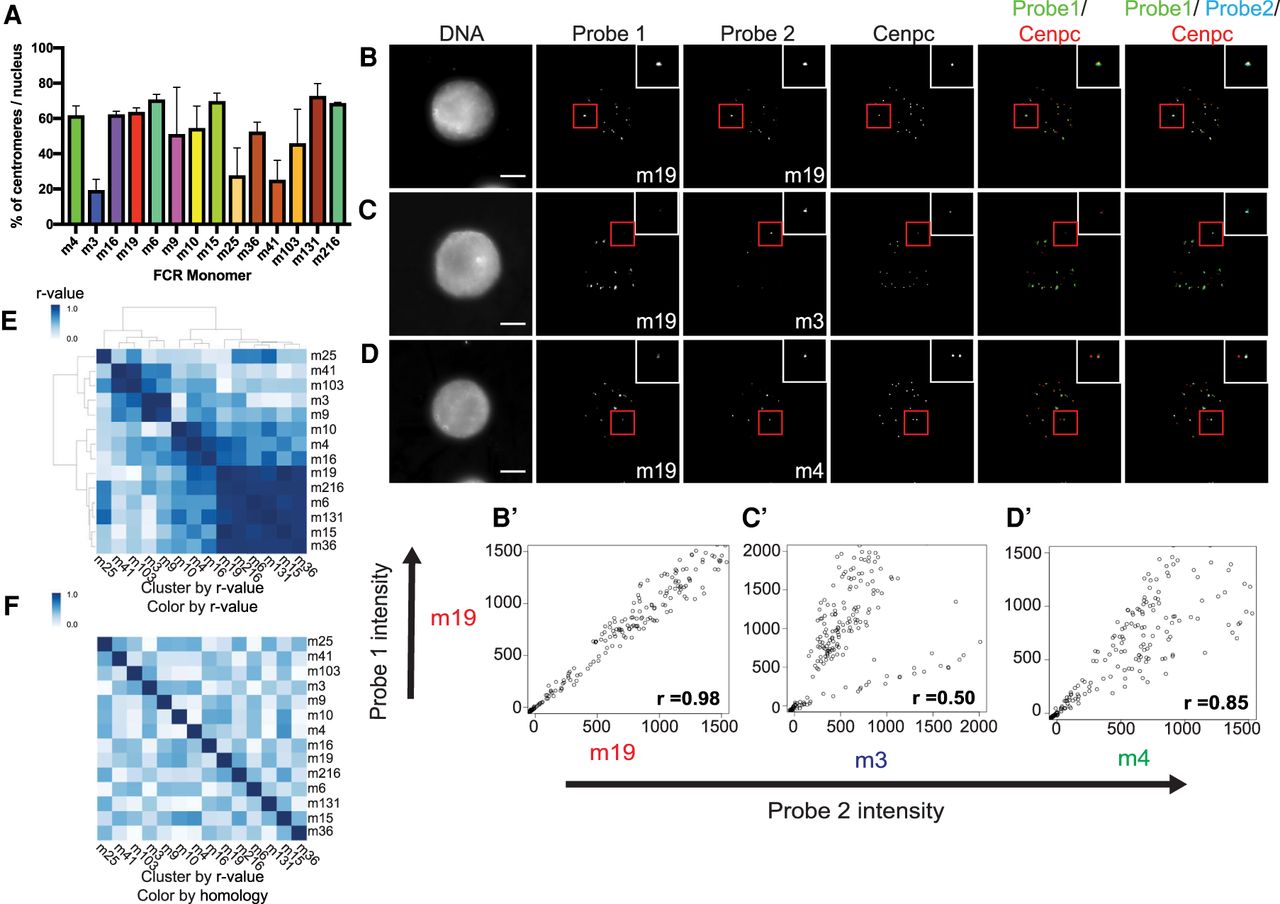
FCR monomers exhibit distinct centromeric localization independent of sequence similarity. (A) Bar plot of the percentage of centromeres per nucleus that are positive for a given FCR monomer. Bar color corresponds to color on phylogram. Averages of two independent experiments are shown with standard error displayed. (B–D) Maximum projection images of two-color FISH with immunofluorescence for the centromere marker, Cenpc. (B) FCR monomer 19 versus FCR monomer 19, (C) FCR monomer 19 versus FCR monomer 3, (D) FCR monomer 19 versus FCR monomer 4. Scale bar, 10 µM. (B′,C′,D′) Scatterplots of background subtracted probe intensities for each centromere from two-color FISH experiments. Pearson coefficients are displayed in the bottom right corner. (E) Clustered heat map of FCR monomer Pearson correlation to other FCR monomers as determined by two-color FISH. (F) Heat map ordered based on FISH Pearson correlation clustering; color map displays sequence similarity between FCR monomers.


