
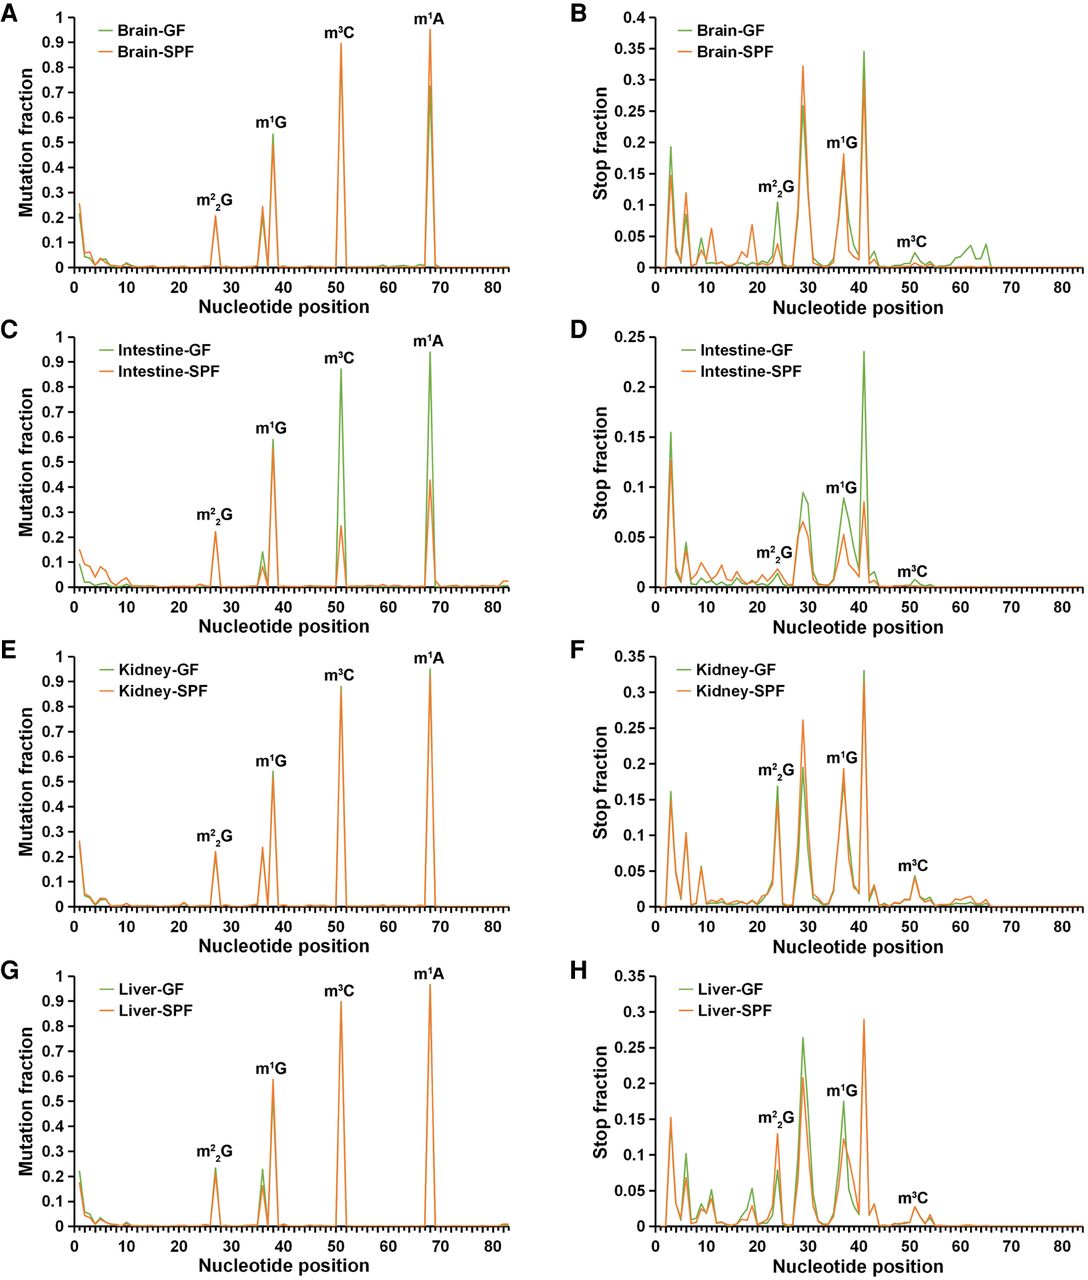
Figure 6.
Mutation and stop plots for the cytosolic tRNALeu-CAG isoacceptor in four tissues (n = 3 for both GF and SPF mice) from the −DM libraries. (A) Mutation plot for the brains. (B) Stop plot for the brains. (C) Mutation plot for the intestines. (D) Stop plot for the intestines. (E) Mutation plot for the kidneys. (F) Stop plot for the kidneys. (G) Mutation plot for the livers. (H) Stop plot for the livers. The stop fractions at and after m1A58 are not shown. The x-axis corresponds to the nucleotide position along the tRNA. Watson-Crick face methylations that are sensitive to demethylase treatment can be easily identified from the mutation plots. (m22G) N2,N2-dimethylguanosine.


