
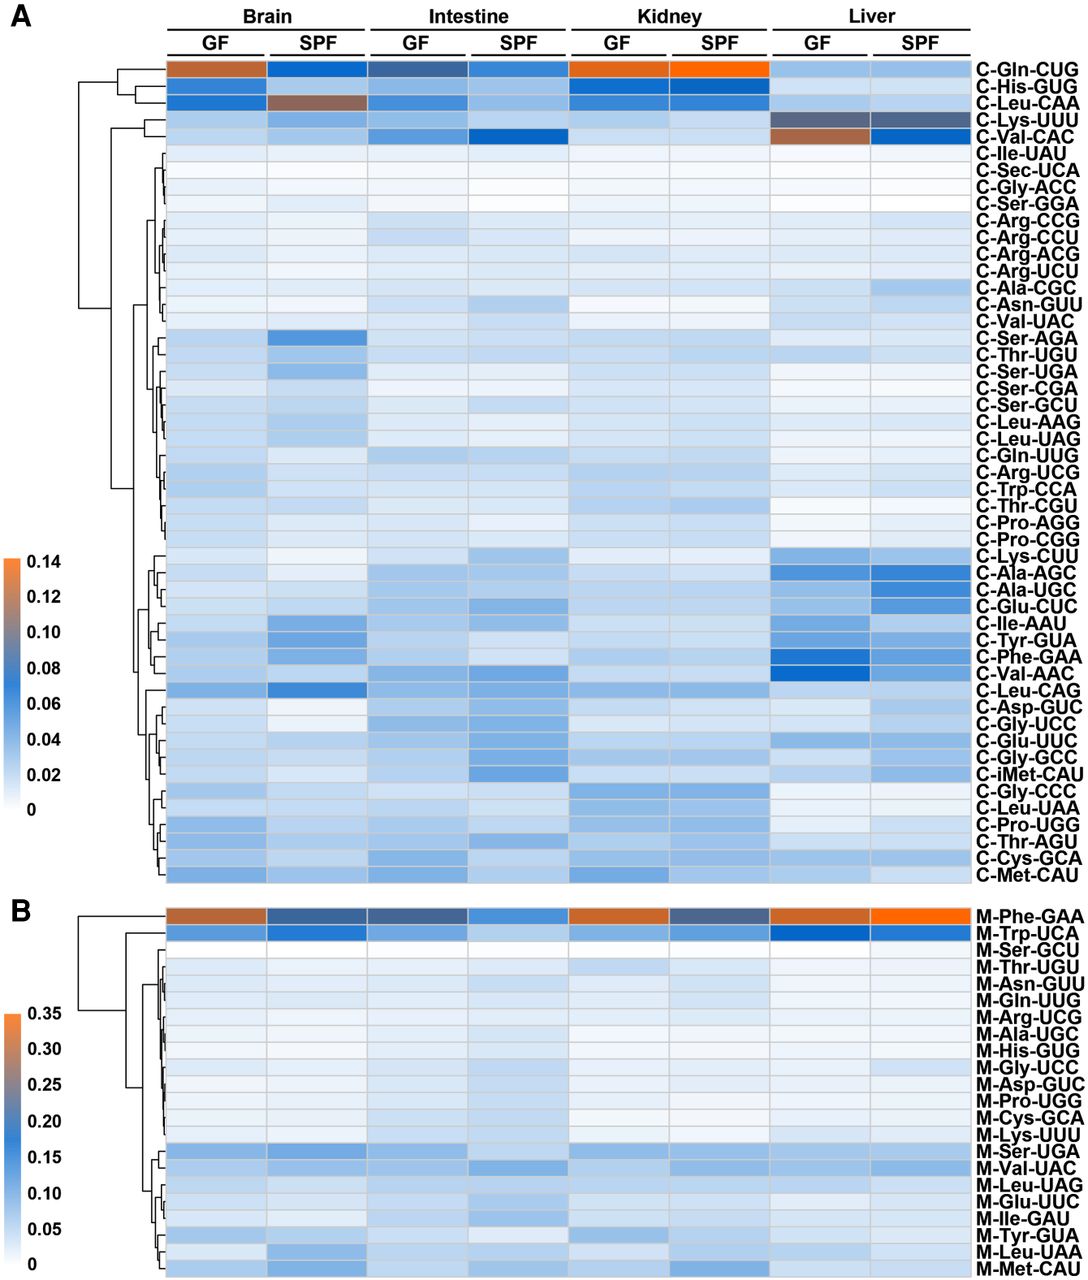
Figure 4.
tRNA composition heat maps at the isoacceptor level. tRNA proportions were calculated based on the FPKM values of 49 cytosolic and 22 mitochondrial tRNA isoacceptors among total cytosolic or mitochondrial isoacceptors, respectively. (A) Heat map of cytosolic tRNAs. (B) Heat map of mitochondrial tRNAs.


