
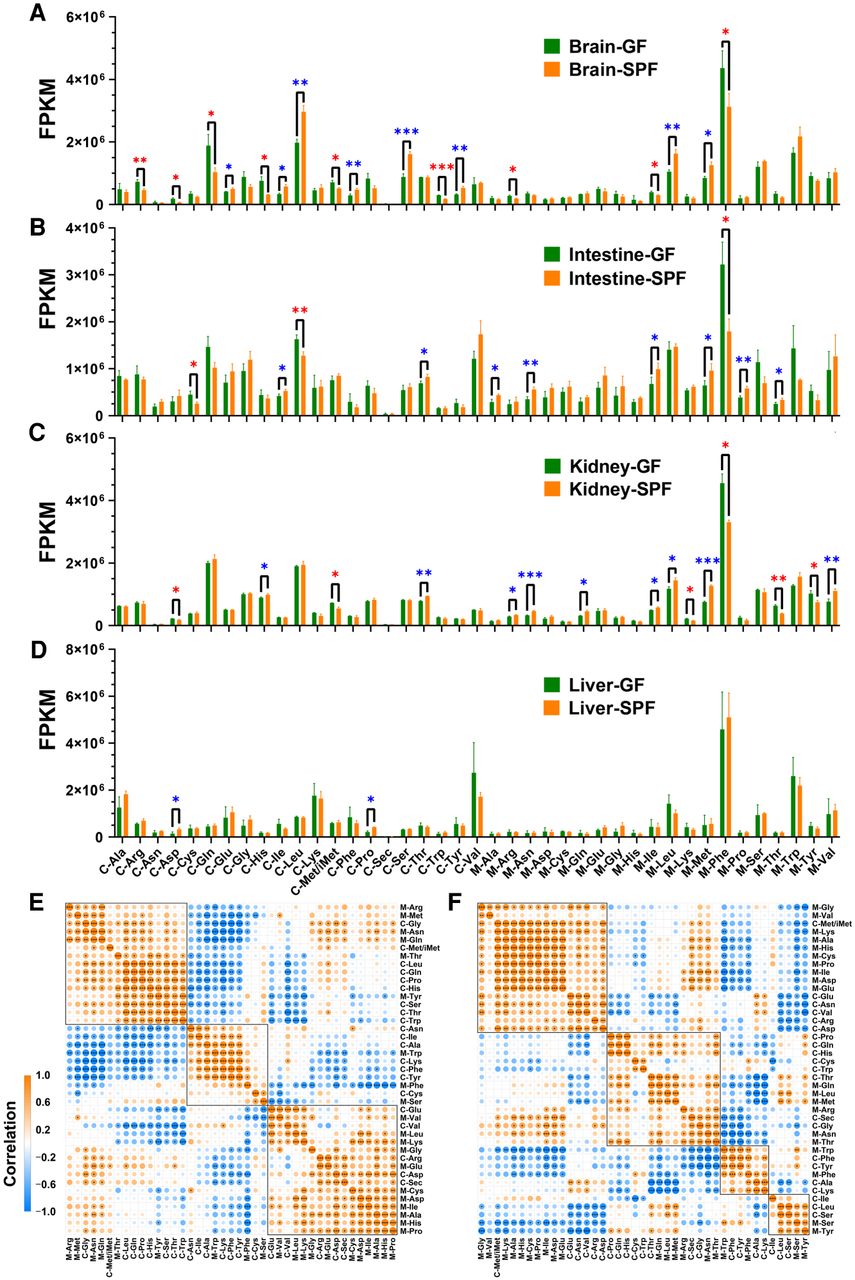
tRNA expression–related analyses at the amino acid isotype level. tRNA expression was measured by the FPKM values of 21 cytosolic and 20 mitochondrial tRNA isotypes. (A–D) tRNA expression in four tissues (n = 3 for both GF and SPF mice). (E,F) tRNA coexpression correlation plots for the GF and SPF mice obtained by combining the data from the four tissue types (brain, intestine, kidney, and liver; each n = 3). (A) tRNA expression in the brains. (B) tRNA expression in the intestines. (C) tRNA expression in the kidneys. (D) tRNA expression in the livers. (E) tRNA coexpression correlation plot for the GF mice. (F) tRNA coexpression correlation plot for the SPF mice. Significant differences were determined with the unpaired Student's t-test. (*) P < 0.05, (**) P < 0.01, (***) P < 0.001. For A–D, red asterisks indicate the tRNA isotypes significantly down-regulated in the SPF mice compared with the GF mice, whereas blue asterisks indicate the tRNA isotypes significantly up-regulated in the SPF mice compared with the GF mice. In E and F, the squares indicate hierarchical clusters.


