
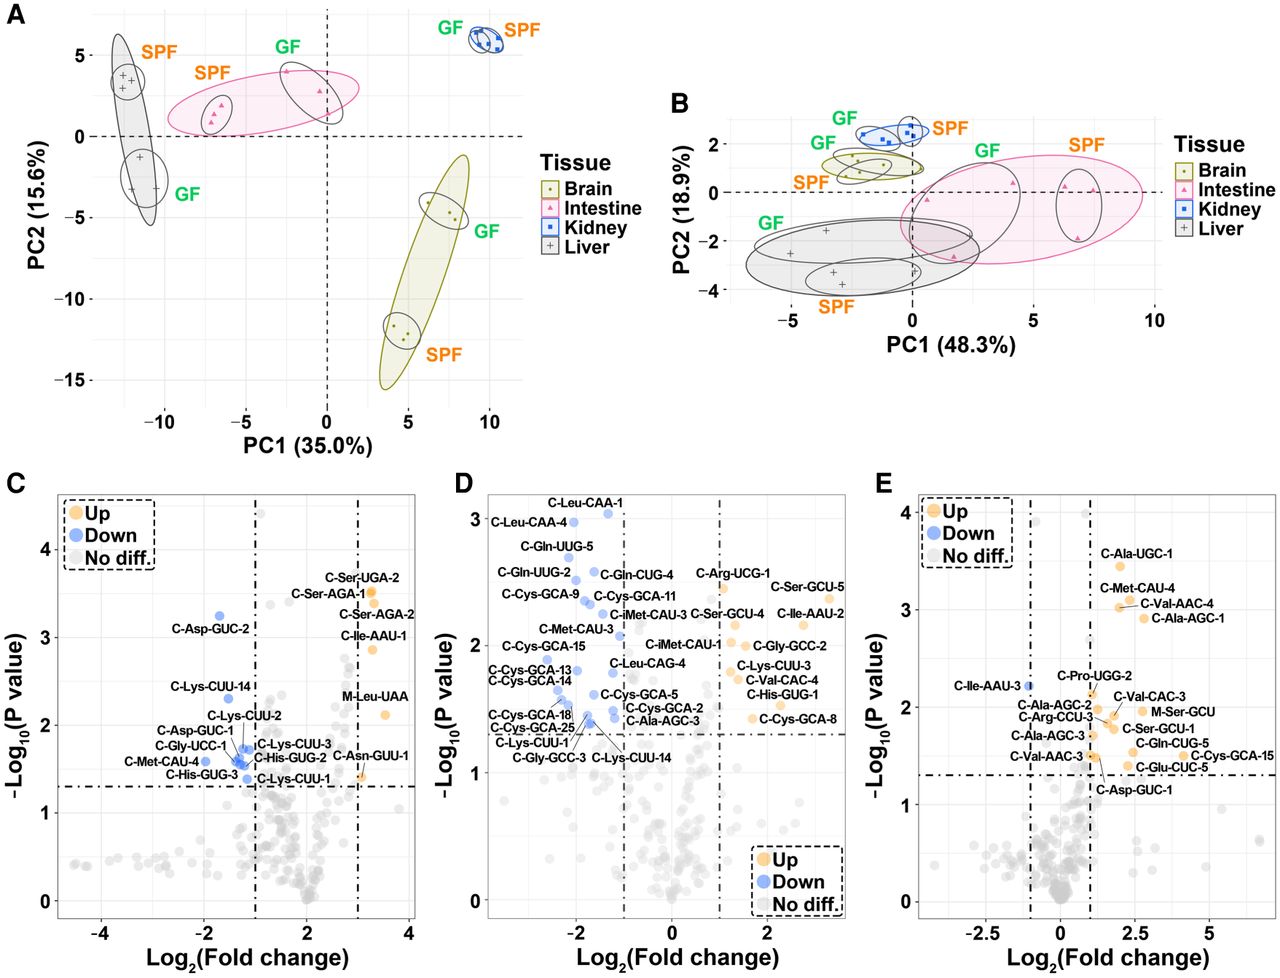
tRNA expression–related analyses at the isodecoder level. (A,B) Principal component analyses (PCAs); (C–E) Volcano plots based on the fragments per kilobase per million (FPKM) values of 216 cytosolic and 22 mitochondrial tRNAs from three tissues (n = 3, SPF vs. GF mice). (A) PCA based on the FPKM values of 216 cytosolic tRNA isodecoders. (B) PCA based on the FPKM values of 22 mitochondrial tRNA isoacceptors. (C) Volcano plot for the brains. (D) Volcano plot for the intestines. (E) Volcano plot for the livers. For C–E, P < 0.05 and log2 (fold change) > 1 were set as the thresholds of significance, and the names of the significant cytosolic tRNA isodecoders follow the names in the Genomic tRNA Database (GtRNAdb, http://gtrnadb.ucsc.edu/genomes/eukaryota/Mmusc10/). (C) Cytosolic tRNA, (M) mitochondrial tRNA.


