
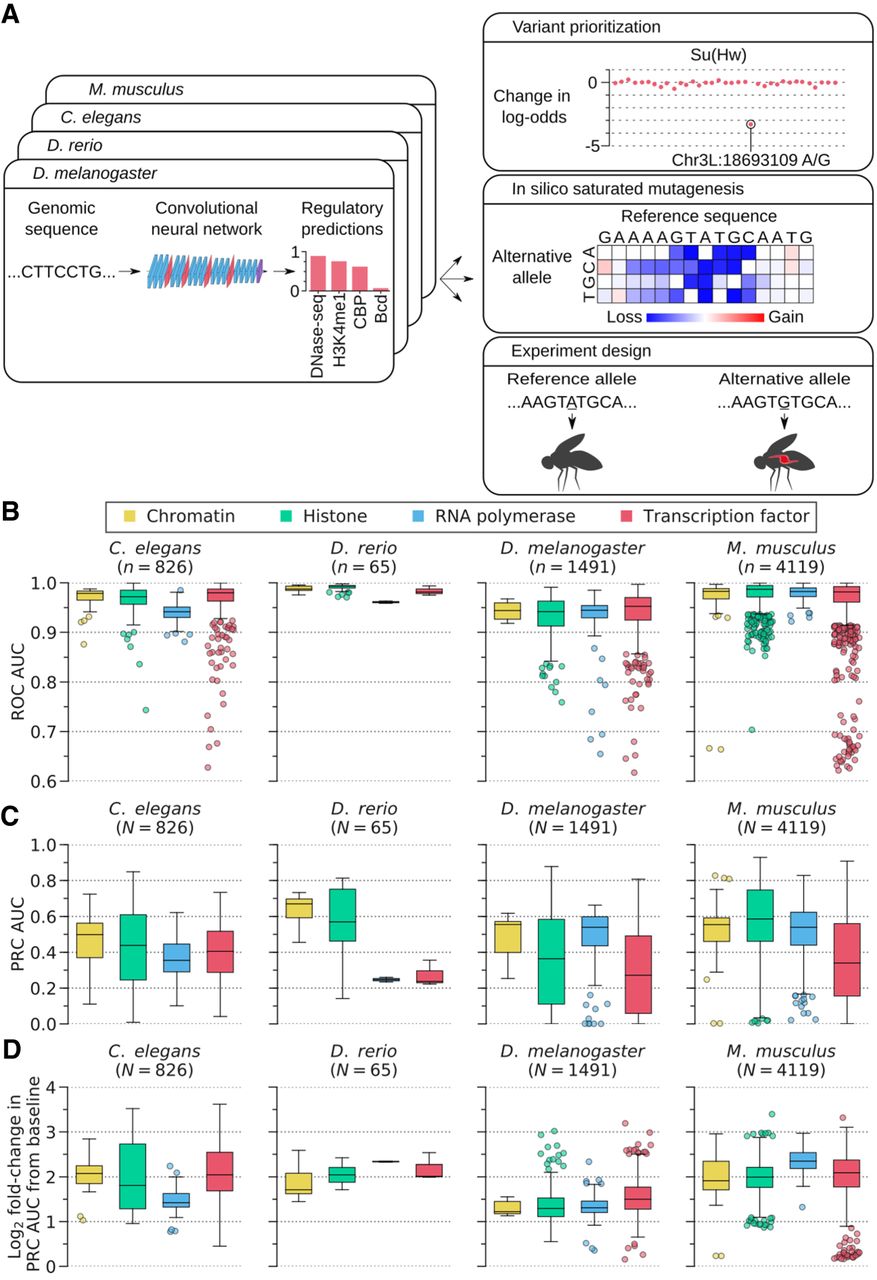
Overview of DeepArk models and their predictive accuracy. (A) The DeepArk architecture (Supplemental Fig. S1) uses convolutional layers to scan an input sequence for regulatory motifs and uses maximum pooling layers to perform dimensionality reduction. By using many successive layers, DeepArk is able to extract complex motifs while presumably leveraging interactions between motifs (LeCun et al. 2015; Avsec et al. 2021) and can use a wide sequence context of 4095 bp. Key applications enabled by DeepArk include prioritizing observed genomic variants by their putative regulatory effects (top right), exposing the predictive sequence features for regulatory events through in silico saturated mutagenesis (middle right), and predicting the regulatory effects of novel variants for prospective experiments (bottom right). (B) Performance on test chromosomes from each organism, as quantified by the area under the curve (AUC) of the receiver operating characteristic (ROC) curve (Supplemental Table S1). Only regulatory features with at least 50 positive test examples are included. For each box plot, the center line marks the median, and the top and bottom edges of the box mark the first and third quartiles, respectively. The top and bottom whiskers extend to 1.5× the interquartile range (IQR), with data points outside of this range considered outliers and plotted individually. (C) DeepArk's performance on the test chromosomes from each organism, here quantified by the AUC for the precision-recall curve (PRC) (Supplemental Table S1). Only regulatory features with at least 50 positive test examples are shown. For each box plot, the center line marks the median, and the top and bottom edges of the box mark the first and third quartiles, respectively. The top and bottom whiskers extend to 1.5× the IQR. Data points outside of this range are considered outliers and plotted individually. (D) Performance on the test chromosomes from each organism in terms of the log2 fold-change in the AUC for the PRC relative to the feature-specific baselines (Supplemental Table S1). Only regulatory features with at least 50 positive test examples are shown. For each box plot, the center line marks the median, and the top and bottom edges of the box mark the first and third quartiles, respectively. The top and bottom whiskers extend to 1.5× the IQR. Data points outside of this range are considered as outliers and plotted individually. DeepArk's performance never falls below the baseline.


