
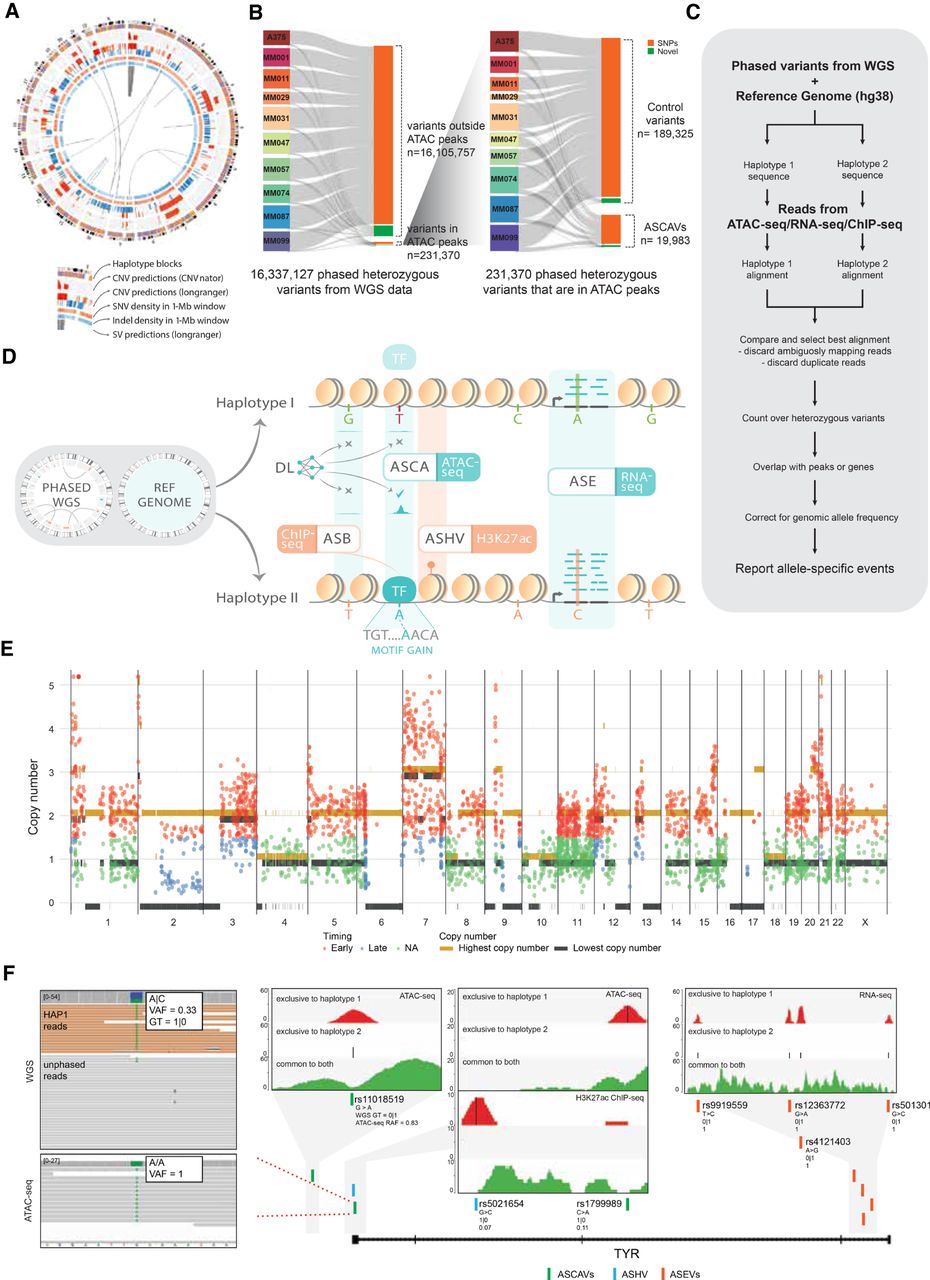
Detection of allele-specific chromatin accessibility. (A) Circos plot for sample MM074. Circos plots for the remaining samples are shown in Supplemental Figure S1. (B) Sankey diagram of the number of variants that went through our ASCAV discovery pipeline. (C) Analysis pipeline for identification of allele-specific events from matched phased whole-genome data and functional genomics data (ATAC-seq, RNA-seq, or ChIP-seq). (D) Phased whole-genome sequencing (WGS) is applied to 10 melanoma cell lines and is used together with the reference genome to create personalized diploid genomes. Matched ATAC-seq, RNA-seq, and ChIP-seq data (against H3K27ac mark and transcription factors [TFs]) are used to detect allelic imbalance in chromatin accessibility (ASCA), gene expression (ASE), histone acetylation (ASHV), or allele-specific binding (ASB). By combining a melanoma-specific deep learning model (DeepMEL2) and motif discovery, cis-regulatory variants are predicted. (E) Genome-wide allele-specific copy number is shown for sample MM074. Superposed are the identified ASCAVs in this cell line, of which the mutation copy number is plotted. The color of the ASCAVs indicates whether they can be classified as either early or late. If their copy number context does not allow timing, they are labeled “na.” Allele-specific copy numbers for the remaining samples are shown in Supplemental Figure S4. (F) Concordant allele-specific events are detected around TYR, a gene encoding an enzyme involved in pigmentation. Inset shows the reads from whole-genome and ATAC-seq data for one of the allele-specific SNPs (rs1799989). Whole-genome data indicate a haplotype 1–specific heterozygous SNP (i.e., GT = 1|0) with a variant allele frequency of 0.33, whereas ATAC-seq data indicate the reads are coming from one allele (haplotype 1). There are a further six allele-specific variants in TYR that are either haplotype 1 (i.e., GT = 1|0) or haplotype 2 (i.e., GT = 0|1) specific in the WGS data, yet all the variants manifest a haplotype-specific activity in matched functional genomics data. The inset plots for all these seven variants show ATAC-seq, H3K27ac ChIP-seq, or RNA-seq reads in these loci segregated into haplotypes. Reads mapping exclusively to haplotype 1 are shown at the top (red), whereas the ones mapping exclusively to haplotype 2 are shown in the middle (blue). We can detect exclusive mapping only at the variant locations; hence, the majority of the reads map equally well to both haplotypes and are shown at the bottom (green). Additionally, reference allele fractions (RAFs) are shown for all the variants (corrected RAFs are obtained via BaalChIP for ASCAVs and ASHV).


