
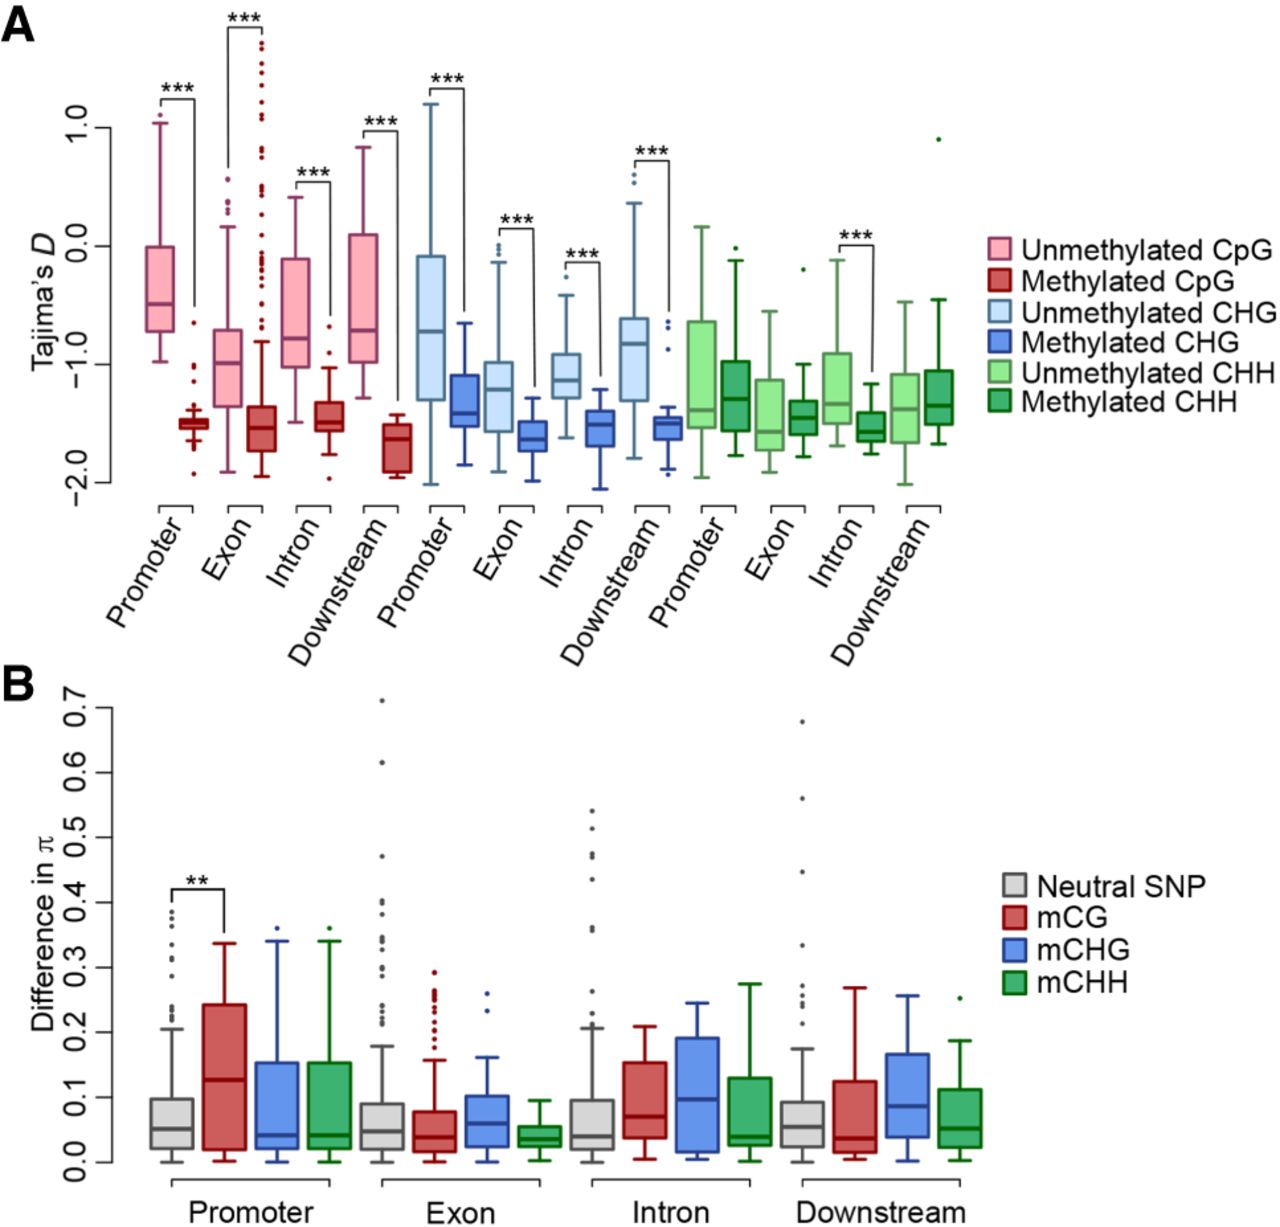
Selective sweep of DNA methylation associated with mQTG expression. (A) Tajima's D values near SMPs associated with mQTG expression. The x-axis represents SMP or SNP locations, and the y-axis represents Tajima's D values. The boxes represent Tajima's D values of accessions with no DNA methylation or accessions with DNA methylation at SMP sites associated with mQTGs having high CVs (top 1%). (B) The differences in nucleotide diversity (π) near SMPs associated with mQTG expression. The x-axis represents the SMP or SNP locations, whereas the y-axis represents the differences in π. Gray boxes represent the π differences of neutral SNPs. The other boxes represent the π differences of each type of SMP associated with mQTGs having high CVs (top 1%). The differences between the neutral SMPs and the SNPs associated with mQTGs were analyzed at each location using a Wilcoxon rank-sum test. In each box plot, the box represents the 25%–75% range, the middle line represents the median, the dotted line represents the 1%–99% range, and the outer circles represent outliers. The differences between the two groups were determined at each location using a Wilcoxon rank-sum test; (***) P < 0.001, (**) P < 0.01.


