
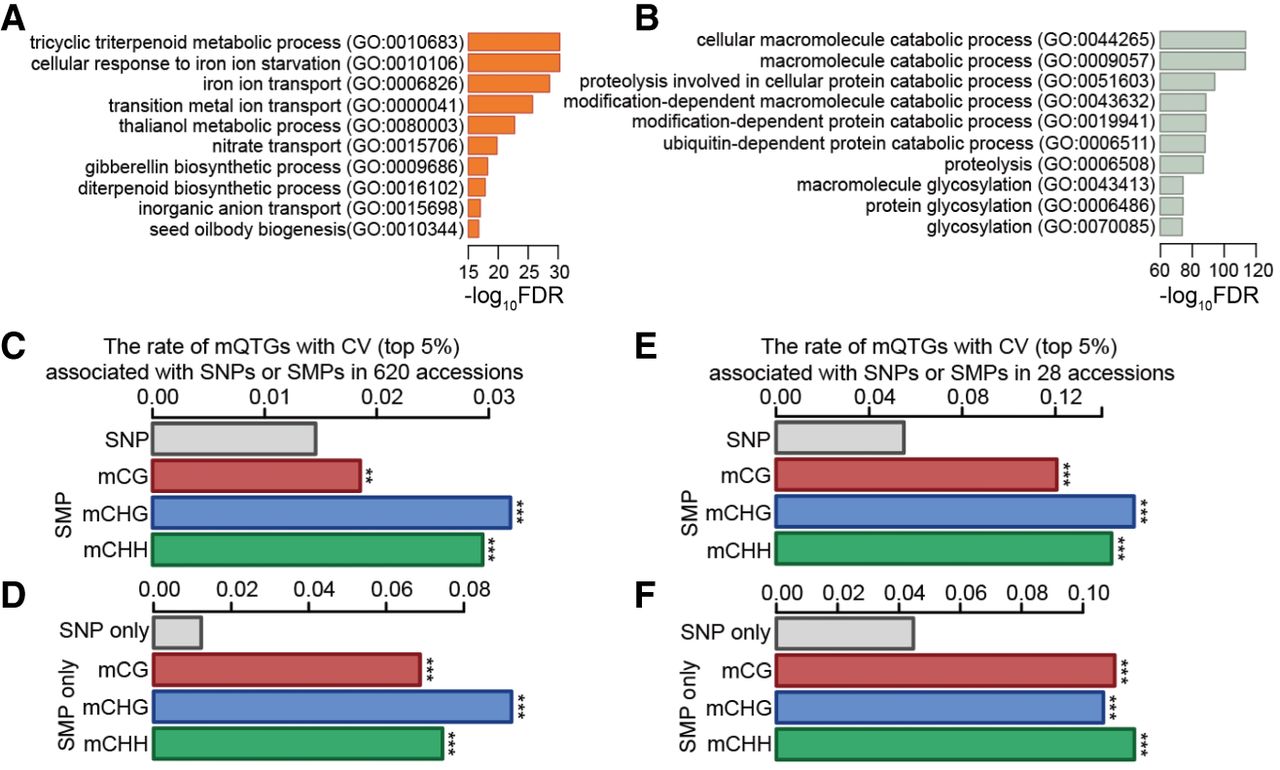
Relationship between DNA methylation and mQTG expression. (A) Top 10 enriched GO terms in genes with high CVs (top 5%). (B) Top 10 enriched GO terms in genes with low CVs (bottom 5%). The false discovery rate (FDR) was calculated from GO enrichment analyses using the χ2 test. (C) The rates of mQTGs having high CVs (top 5%) associated with SNPs, mCGs, mCHGs, and mCHHs in 620 A. thaliana accessions. The rates represent the numbers of mQTGs with high CVs (top 5%) associated with SNPs, mCGs, mCHGs, and mCHHs each divided by the number of total genes associated with SNPs, mCGs, mCHGs, and mCHHs, respectively. (D) The rates of mQTGs with high CVs (top 5%) associated with only SNPs, only mCGs, only mCHGs, and only mCHHs in the 620 accessions. The rates represent the numbers of mQTGs with high CVs (top 5%) associated with only SNPs, only mCGs, only mCHGs, and only mCHHs each divided by the number of genes associated with only mCGs, only mCHGs, and only mCHHs, respectively. (E) The rates of mQTGs with high CVs (top 5%) associated with SNPs, mCGs, mCHGs, and mCHHs in 28 accessions. (F) The rates of mQTGs with high CVs (top 5%) associated with only SNPs, only mCGs, only mCHGs, and only mCHHs in 28 accessions. The differences in the rates between SNPs and each of the three kinds of SMPs (mCGs, mCHGs, and mCHHs) were evaluated using the χ2 test; (***) P < 0.001, (**) P < 0.01.


