
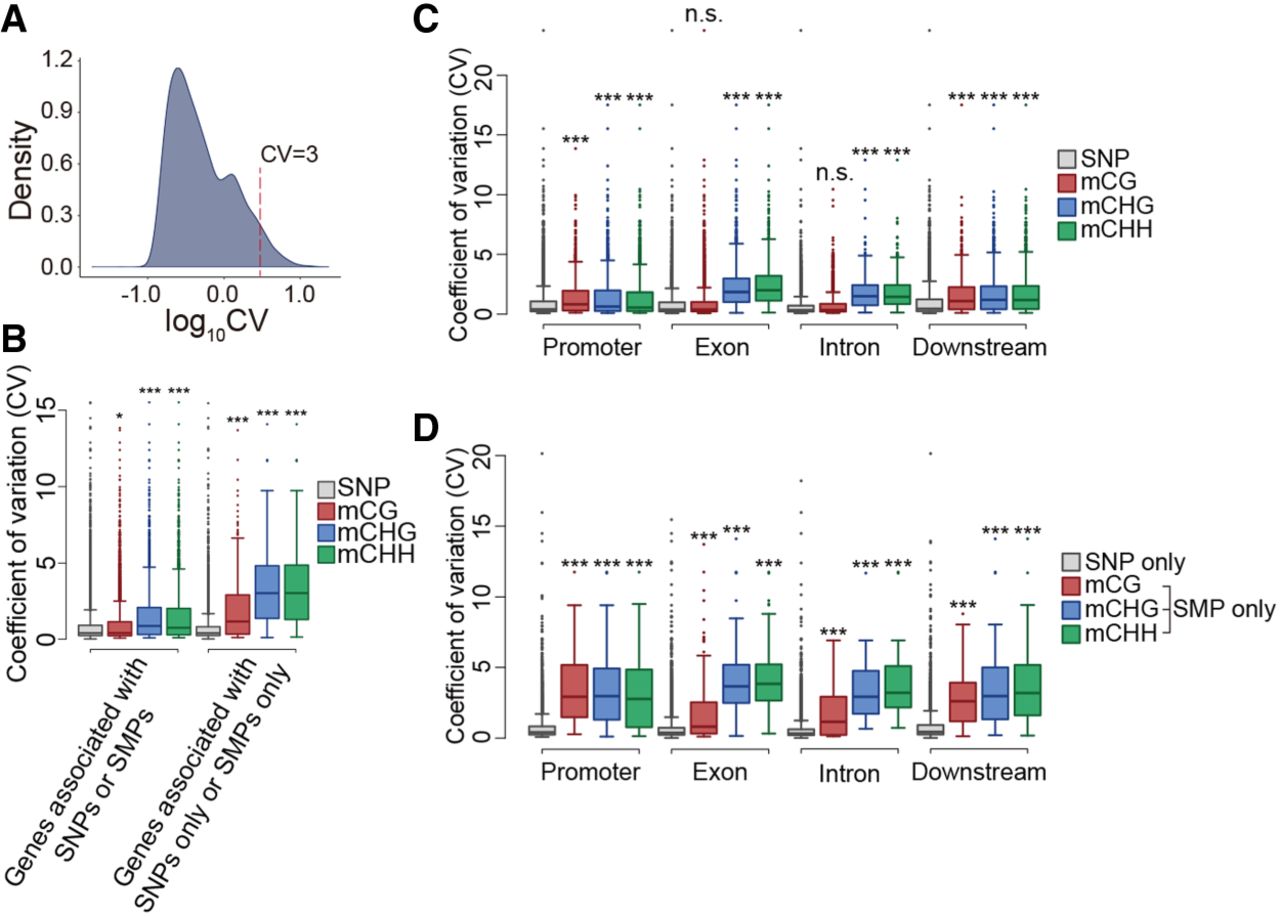
Variation in the expression of genes associated with SMPs or SNPs. (A) Coefficients of variation (CVs) for 24,320 genes from 620 accessions. (B) CVs of genes associated with SNPs, mCGs, mCHGs, and mCHHs. (C) CVs of genes associated with SNPs, mCGs, mCHGs, and mCHHs located in promoter, exon, intron, or downstream regions. (D) CVs of genes associated with only SNPs, only mCGs, only mCHGs, and only mCHHs located in promoter, exon, intron, or downstream regions. In each box plot, the box represents the 25%–75% range, the middle line represents the median, the dotted line represents the 1%–99% range, and the outer circles represent outliers. The significant differences in CVs among genes associated with SNPs and the SMP groups were evaluated using the Wilcoxon rank-sum test; (***) P < 0.001, (*) P < 0.05, (ns) not significant.


