
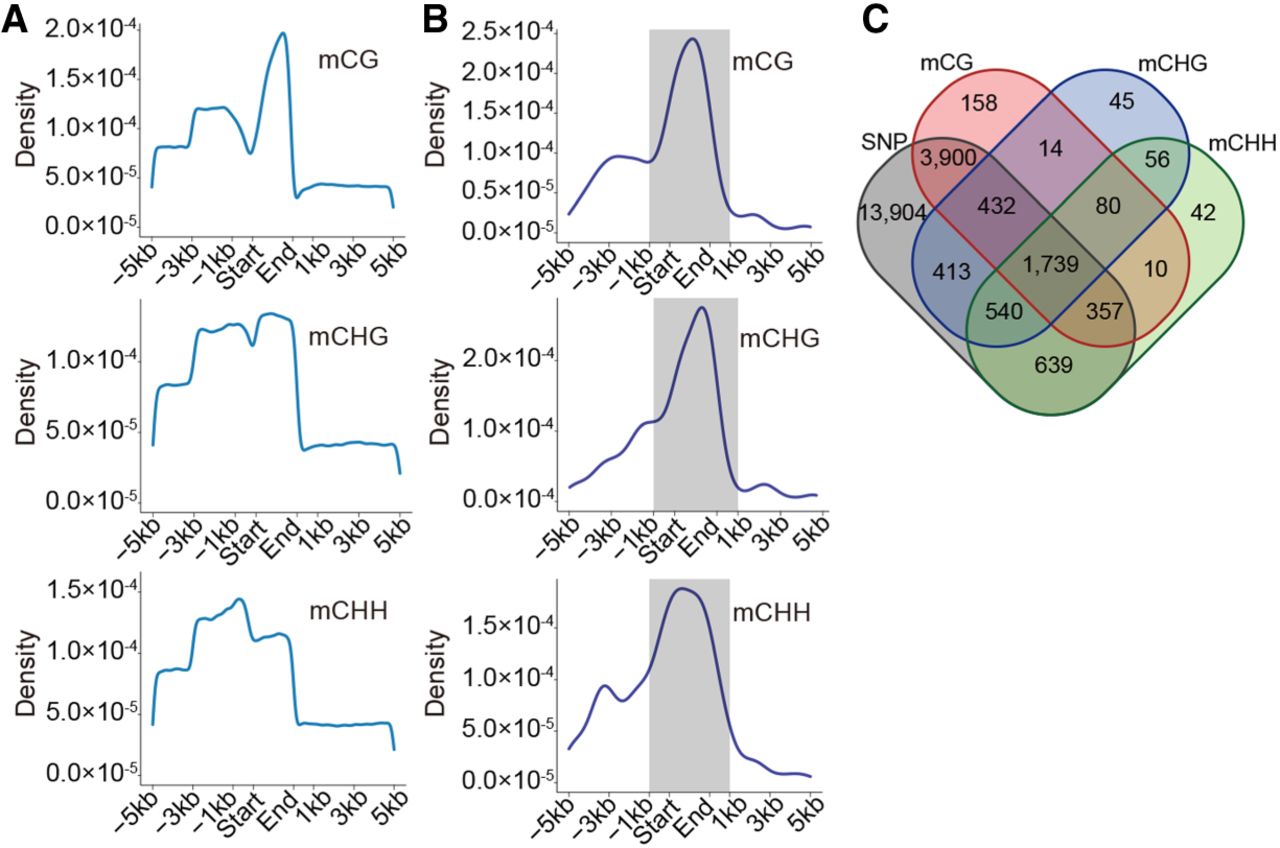
Distribution of DNA methylation associated with gene expression. (A) The distributions of mCGs, mCHGs, and mCHHs in 24,320 genes. The x-axis represents SMP positions relative to the transcriptional start and termination sites in 24,320 genes from 620 A. thaliana accessions. The blue line represents the distribution of the mCGs, mCHGs, and mCHHs. (B) The distributions of mCGs, mCHGs, and mCHHs associated with gene expression in a cis-regulatory manner in 1000 randomly selected genes. The x-axis represents SMP positions relative to the transcriptional start and termination sites in 1000 randomly selected genes from 620 A. thaliana accessions. (C) The numbers of genes with significant associations between expression and mCGs, mCHGs, mCHHs, or SNPs.


