
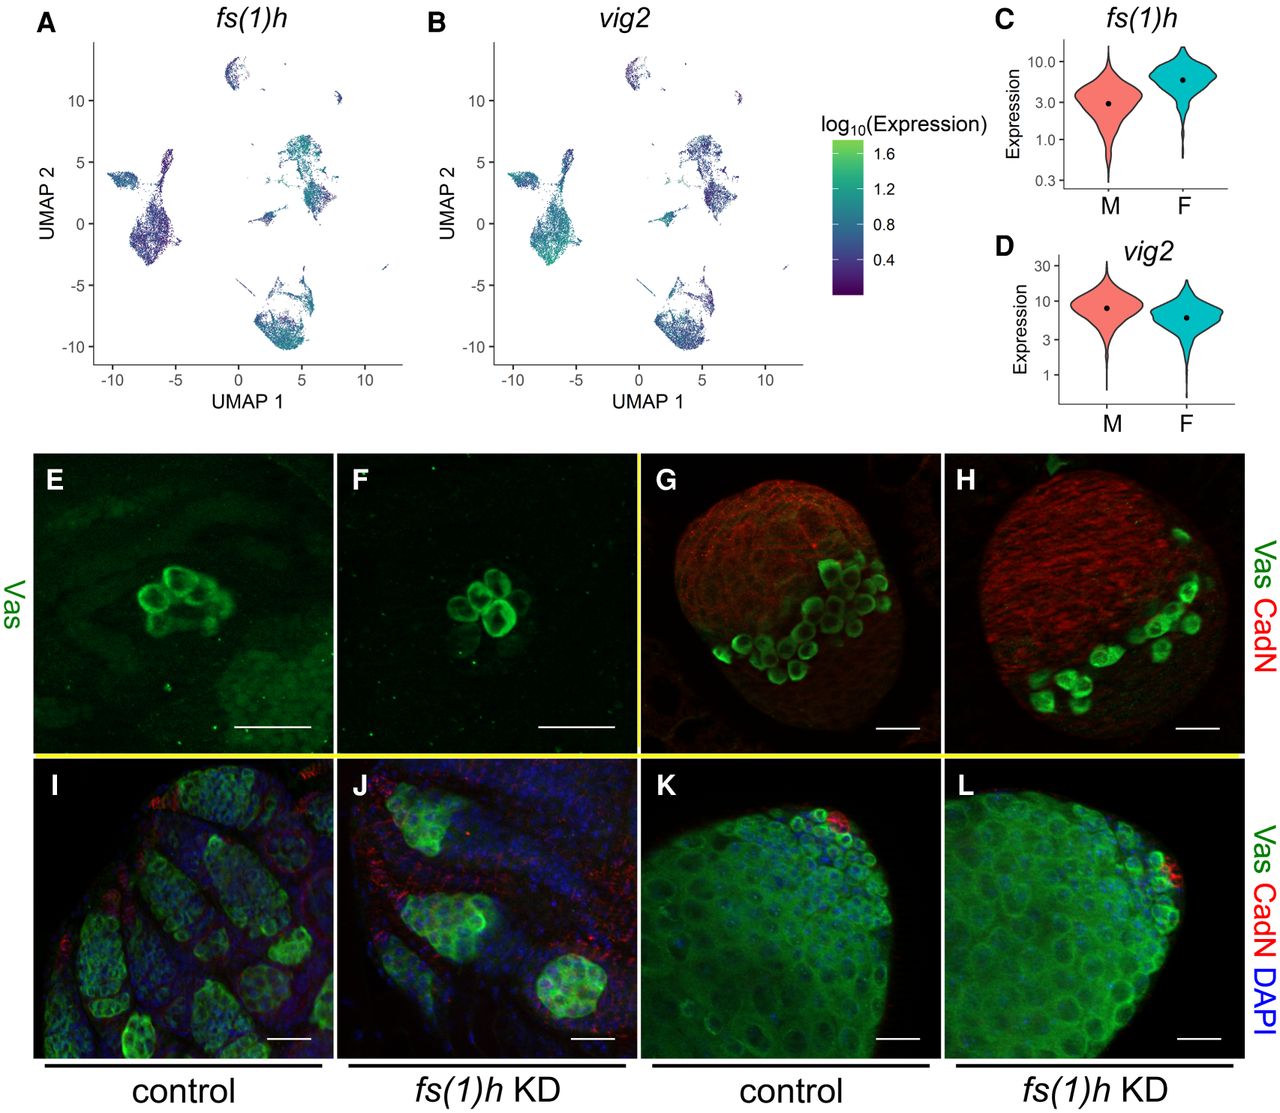
Female-specific involvement of fs(1)h in germline development. (A,B) Expression profiles of fs(1)h (A) and vig2 (B) in the sexed data set. Color codes of the expression levels are indicated to the right. (C,D) Violin plots of the female marker fs(1)h (C) and male marker vig2 (D). Orange and turquoise populations indicate male and female expression levels, respectively. (E–L) RNAi knockdown phenotypes of fs(1)h in the germline of ovaries at embryonic stage 17 (E,F), third-instar larva (G,H), newly eclosed adult females (I,J), and testes from newly eclosed males (K,L). (E,G,I,K) Controls (nos-Gal4/+); (F,H,J,L) Germline knockdown of fs(1)h (HMS02723/+;nos-Gal4/+). (E,F) Stained with a Vasa antibody (green); (G,H) stained with Vasa (green) and Cadherin-N (red) antibodies; and (I–L) stained in addition with DAPI (blue). Scale bars, 20 µm.


