
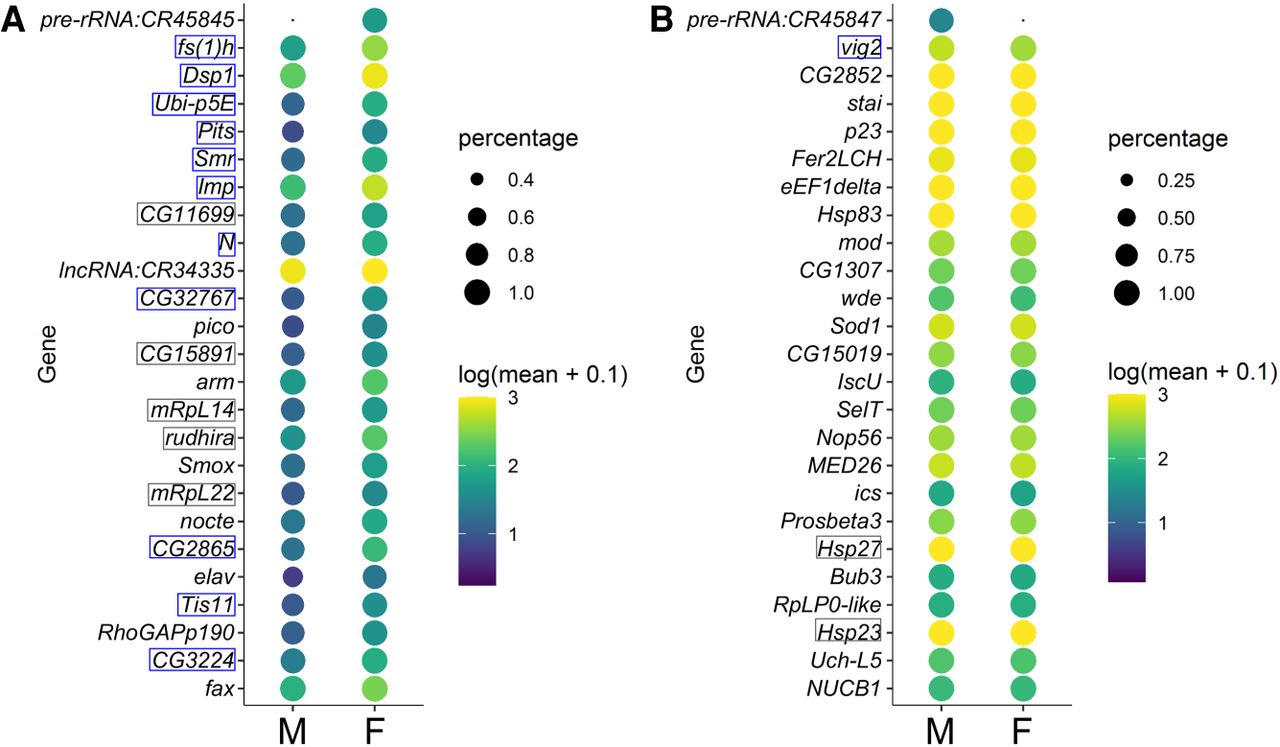
Figure 5.
Top sex markers from the sexed data set. (A) Expression profiles of the top 25 female markers in the male and female germline clusters after zygotic activation are plotted, with the colors reflecting mean expression as indicated on the right; the size of the dots reflects the fraction of cells in the clusters with detectable expression of each gene. The gene names boxed in gray or blue are those also determined as top female markers in the unsexed data set (Supplemental Fig. S9); the ones predicted to be transcription- or chromatin-associated factors are marked with blue boxes. (B) Expression patterns of the top 25 male markers plotted in the same way as in A.


