
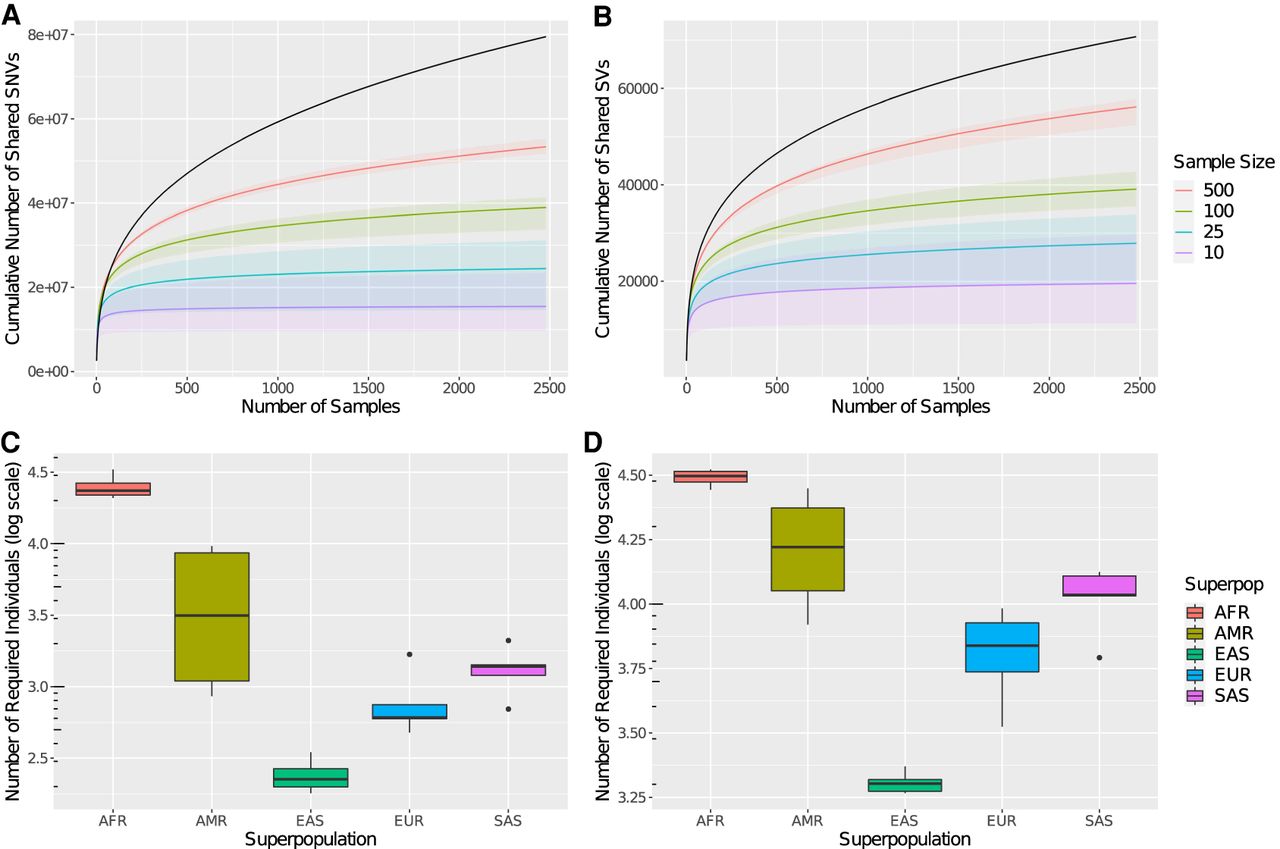
The 1000 Genomes Project extrapolated superpopulation diversity. (A,B) Extrapolating the number of shared variants covered with subsamples. In black is the shared diversity of the full data set. The lines represent the median number of covered variants over 100 trials of the given sample size. The ribbons represent the minimum and maximum number of covered variants over 100 trials of the given sample size. The left panel is calculated on SNVs, and the right panel is calculated on SVs. (C,D) Box plots of subpopulation diversity by superpopulation. For each subpopulation, the predicted total amount of shared variants for 100,000 individuals is calculated. Then, the number of sequenced individuals necessary to obtain 90% of this diversity is calculated. Finally, box plots of the number of required individuals (log scale) are plotted for the corresponding subpopulations in each superpopulation. The left panel is calculated on SNVs, and the right panel is calculated on SVs.


