
Figure 4.
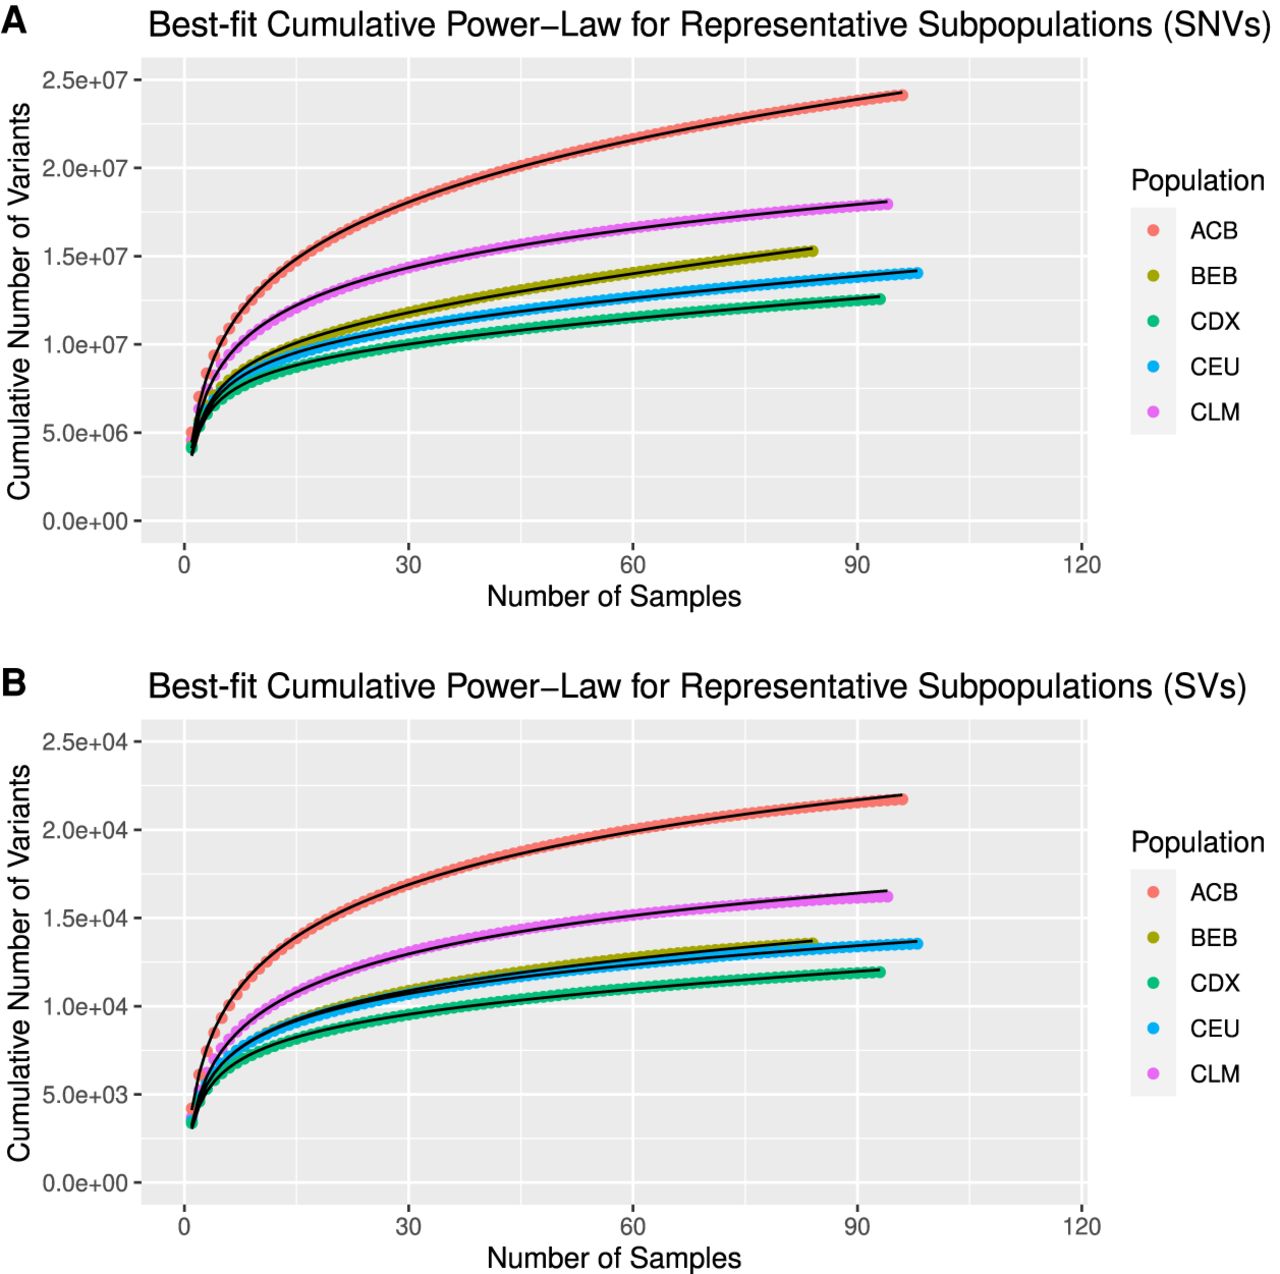
SVCollector curves and best-fit cumulative power-law models for SNVs (A) and SVs (B). Data are shown for one representative subpopulation for each superpopulation in the 1000 Genomes Project.
(Downloading may take up to 30 seconds. If the slide opens in your browser, select File -> Save As to save it.)
Click on image to view larger version.
SVCollector curves and best-fit cumulative power-law models for SNVs (A) and SVs (B). Data are shown for one representative subpopulation for each superpopulation in the 1000 Genomes Project.
 CiteULike
 Delicious
 Digg
Digg Facebook
 Google+
 Reddit
 Twitter
