
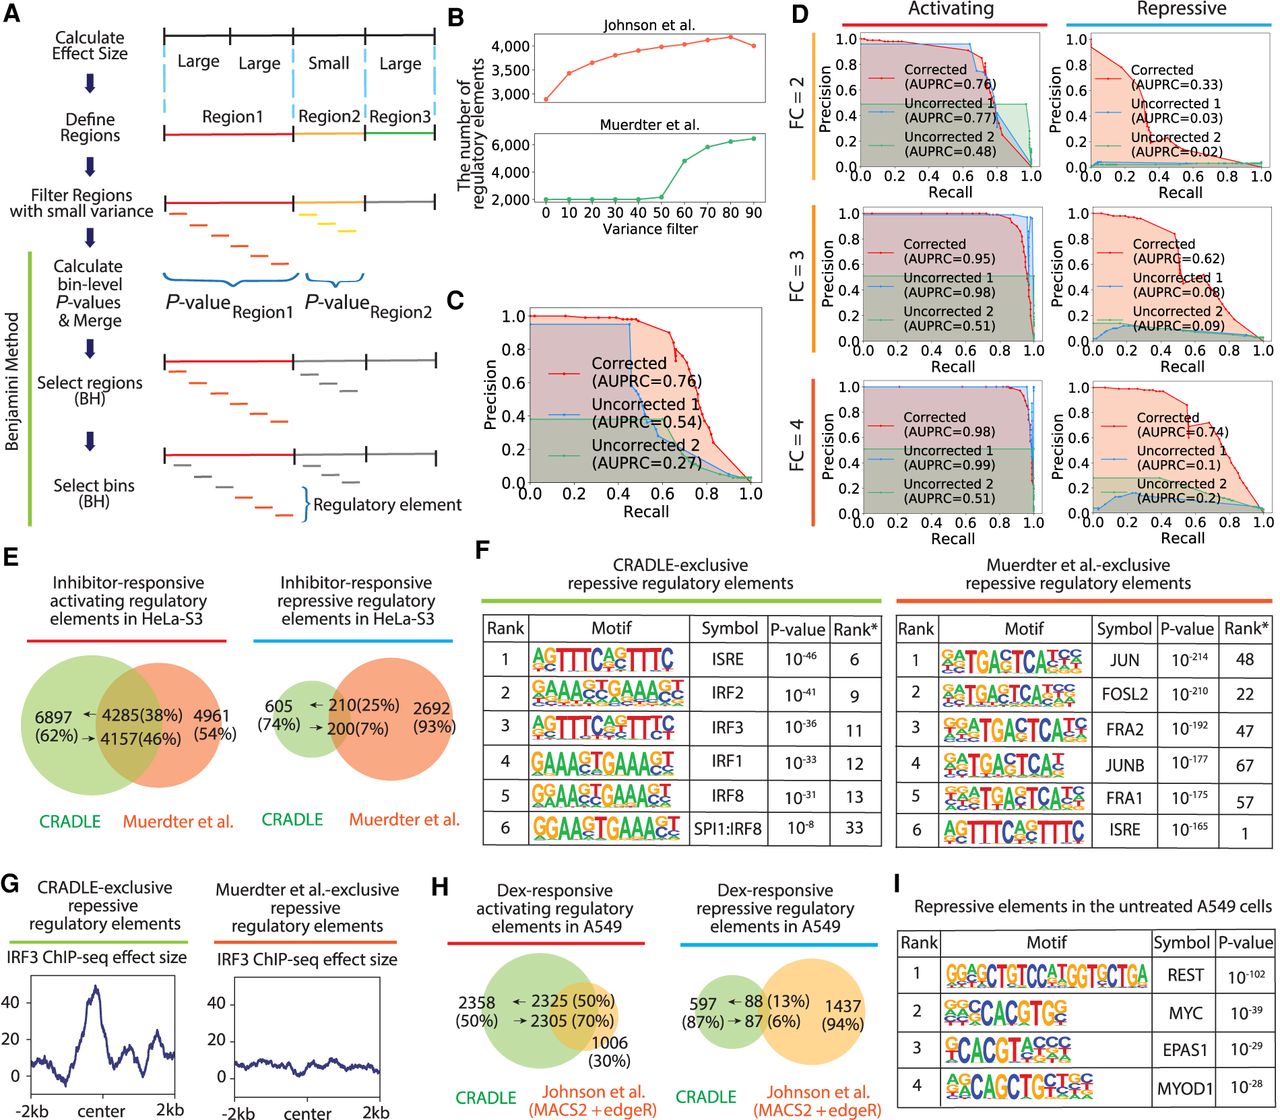
Detection of regulatory elements with CRADLE. (A) CRADLE regulatory element pipeline is shown in diagram. Effect sizes are calculated in windows of uniform length. Contiguous windows with similar effect sizes are merged into regions before filtering regions with small variance. Regions are binned and a statistical test is performed on each bin to compare corrected input and output signals. Bin-level P-values are merged to generate a region-level P-value before performing a region-level Benjamini–Hochberg (BH) procedure. Regions selected by the first BH procedure were used to perform a bin-level BH procedure to identify regulatory elements. (B) The number of detected regulatory elements is dependent on the variance filter. (C,D) Precision recall curves, using corrected and uncorrected signals in the simulation study. To detect regulatory elements with uncorrected signals, two statistical approaches were used: (1) fitting uncorrected signals to Poisson GLM and performing Wald test (“Uncorrected 1”) and (2) using a Poisson distribution with the mean of uncorrected input signals as a null distribution and testing the significance of the mean of uncorrected output signals (“Uncorrected 2”). (C) Precision recall curve when signals are simulated with mixed fold change (2, 3, 4) and a mix of activating and repressive elements. (D) Precision recall curve when signals are simulated with a fixed fold change (FC) and with a fixed regulatory activity (either activating or repressive). (E–G) Comparison of inhibitor-responsive regulatory elements detected by CRADLE and Muerdter et al. (2018). (E) The Venn diagram shows the overlap of regulatory elements detected by both studies. (F) Transcription factor motif enrichment is shown for inhibitor-responsive repressive regulatory elements exclusively detected by each study. Rank* is the rank of motif in the other study. (G) The mean of IRE3 ChIP-seq effect size is plotted for inhibitor-responsive repressive regulatory elements exclusively detected by each study. (H) The Venn diagram shows the overlap of dex-responsive activating and repressive regulatory elements detected by CRADLE and Johnson et al. (2018). (I) Transcription factor motif enrichment in A549 steady-state repressive regulatory elements detected by CRADLE.


