
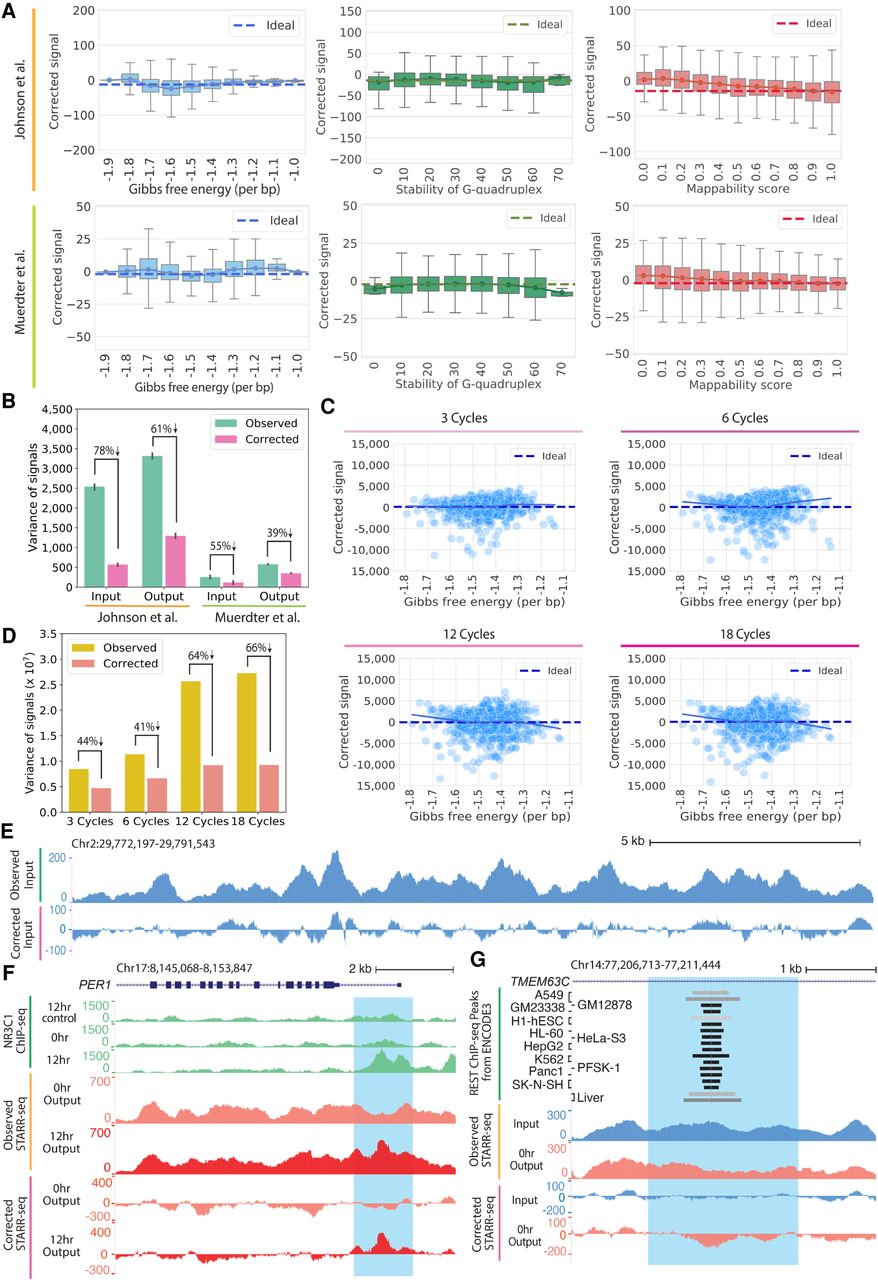
The CRADLE GLM approach corrects technical bias. (A) STARR-seq signals are plotted for 500-bp windows along Chromosome 1 after removing technical bias with CRADLE. Signal is balanced despite varying degrees of technical biases. The ideal line is the median corrected signal. Whiskers extend 1.5 times the interquartile range. Center lines in the boxes show the medians. (B) Variance in observed signals and CRADLE-corrected signals in 1-bp windows are shown along Chromosome 1. The error bars indicate variance between replicates; six input libraries and five 0-h dex-treated output libraries in Johnson et al. (2018) are plotted; two input libraries and two no-inhibitor-treated output libraries in Muerdter et al. (2018) are plotted. (C) STARR-seq signals are shown for PER1 BAC libraries amplified with different numbers of PCR after removing technical bias with CRADLE. Each point represents the sum of corrected signals in a 500-bp window from three technical replicates. The solid line is a lowess fit line. The dashed ideal line is the median signal across all windows. (D) Variance in observed signals and CRADLE-corrected signals in 1-bp windows are shown after correcting the PER1 BAC libraries. (E) Representative signal tracks are shown for STARR-seq input libraries before and after CRADLE correction (Chr 2: 29,772,197–29,791,543). (F) STARR-seq and ChIP-seq signal tracks are shown in the dex-responsive PER1 locus. Observed and corrected signal of Johnson et al. (2018) are presented for 0-h dex-treated (untreated) and 12-h dex-treated output libraries. ChIP-seq signal tracks are not corrected. The highlighted region (Chr 17: 8,151,204–8,152,809) is a known dex-responsive activating regulatory element. (G) STARR-seq signal tracks are shown for the TMEM63C locus. Observed and corrected signal of Johnson et al. (2018) are presented for input and 0-h dex-treated output libraries. The highlighted region (Chr 14: 77,207,895–77,210,261) contains a REST motif and is occupied by REST in multiple cell types.


