
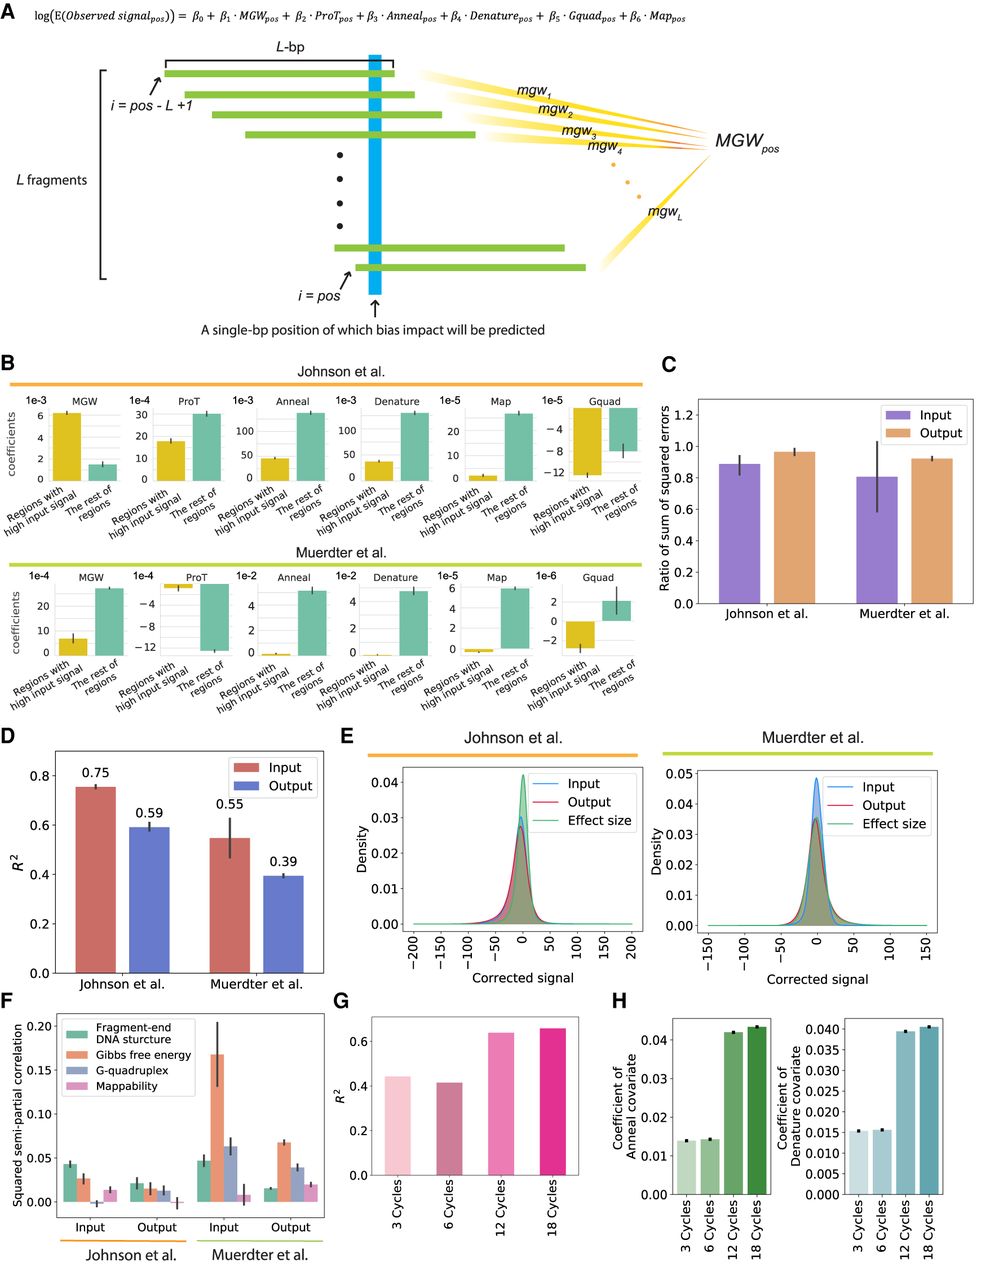
The CRADLE GLM approach accurately predicts signal bias. (A) Equation of the GLM to predict the impact of technical biases and approach used by CRADLE to calculate bias covariates. To estimate bias effects for each position (blue), we used a window centered on that position that was twice the median fragment length, L. We assume L number of fragments (green) in a window and that each fragment is L-bp in length. To calculate each bias covariate for the position, we combined quantitative measures from L fragments. (pos) Single-bp position; (MGWpos) minor grove width; (ProTpos) propeller twist; (Annealpos) annealing efficiency; (Denaturepos) denaturation efficiency; (Gquadpos) G-quadruplex structure; (Mappos) mappability. (B)–(F) The results from the GLM fitted with Johnson et al. (2018) STARR-seq data (six input libraries and five 0-h dex-treated output libraries) and Muerdter et al. (2018) STARR-seq data (two input libraries and two no-inhibitor-treated output libraries). For C–F, the results were visualized for Chromosome 1. (B) Coefficients in input libraries for regions with signals above and below the 90th percentile (“Regions with high input signal” and “The rest of regions,” respectively). (C) Ratio of the sum of squared errors with structured sampling to the sum of squared errors with random sampling are plotted for regions with extremely high signals (above the 99th percentile). (D) Variance explained by CRADLE are plotted. The R2 values are from GLMs fitted with input and output STARR-seq libraries. The error bars indicate variance between replicates. (E) Distribution of GLM residuals and the STARR-seq effect sizes are shown after correction. (F) Squared semipartial correlations are shown for fragment-end, Gibbs free energy, G-quadruplex, and mappability covariates. The error bars indicate variance between replicates. (G) The R2 values of the GLMs are shown for PER1 BAC libraries amplified with different numbers of PCR cycles. (H) Coefficients of anneal and denature covariates are shown for the GLM fitted with PER1 BAC libraries. The error bars show a 95% confidence interval.


