
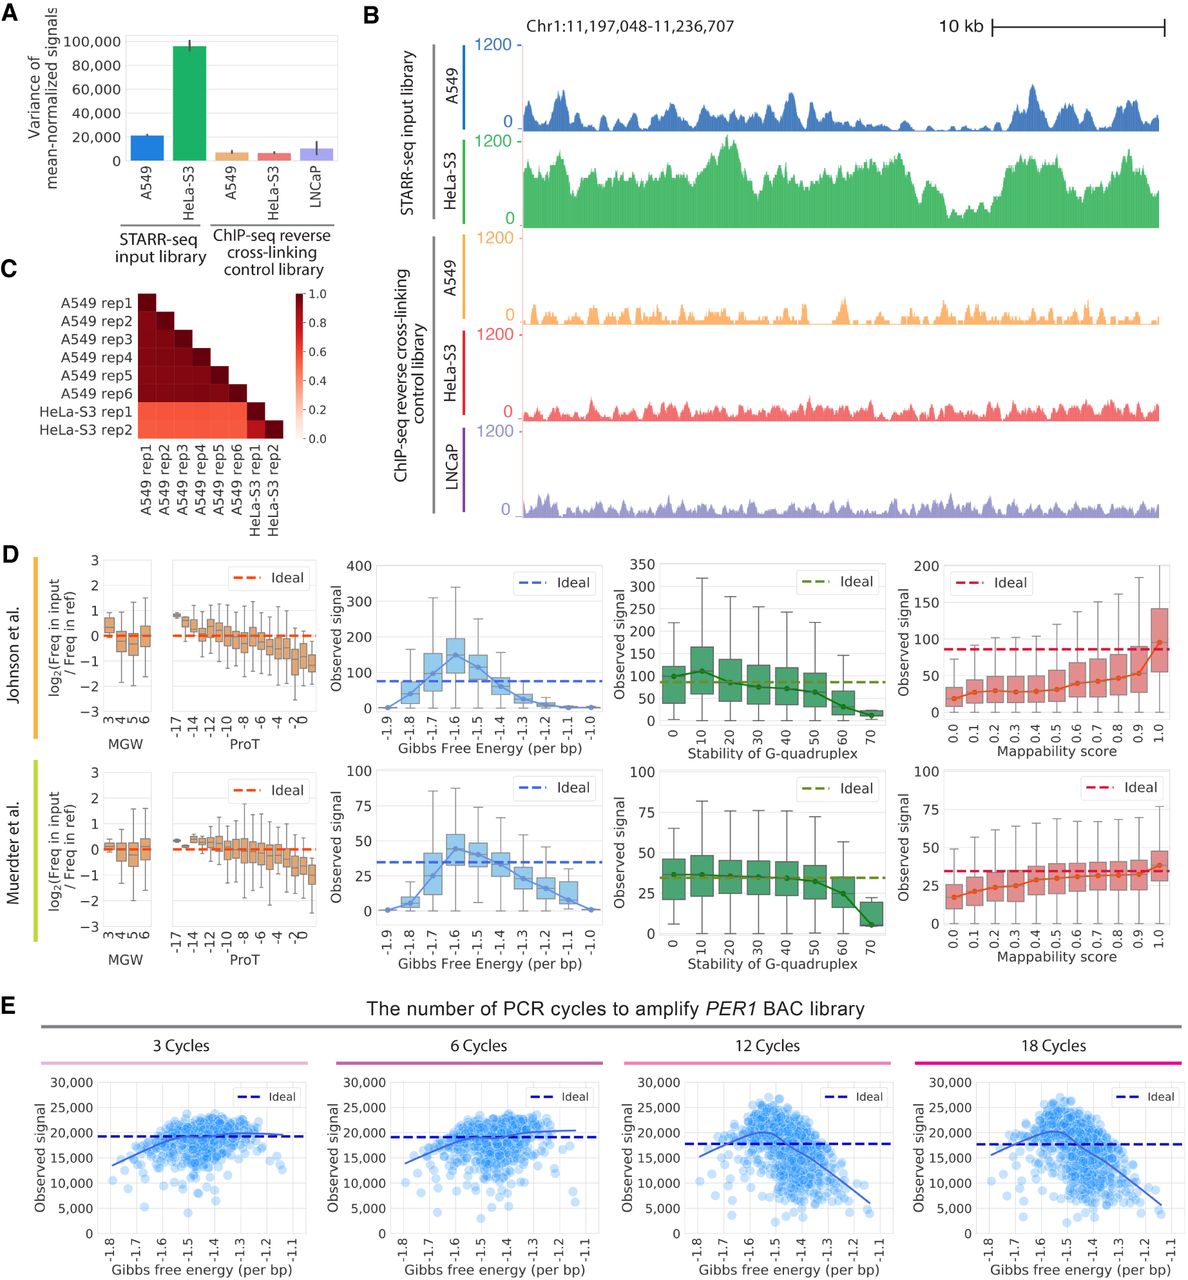
Technical biases affect STARR-seq signal. (A) STARR-seq input libraries have higher signal variance than ChIP-seq input control libraries. Variance in per base signal in individual RPKM-normalized libraries are plotted for Chromosome 1. The error bars indicate variance between replicates. The number of replicates plotted is as follows: six replicates for STARR-seq A549 data; two replicates for STARR-seq HeLa-S3 data; three replicates for ChIP-seq A549 data; two replicates for ChIP-seq HeLa-S3 data; three replicates for ChIP-seq LNCaP data. (B) Representative browser signal tracks are shown for STARR-seq and ChIP-seq input libraries (Chr 1: 11,197,048–11,236,707). Signals are RPKM-normalized. (C) Pearson's correlations of STARR-seq input library signals in 1-bp windows along Chromosome 1. (D) DNA sequence biases impact STARR-seq signals. STARR-seq signals are plotted for 500-bp windows with varying degrees of bias for the following physical properties of DNA: fragment-end DNA structures, Gibbs free energy, G-quadruplex structure, and mappability. Whiskers extend 1.5 times the interquartile range. Center lines in the boxes show the medians. In plots of fragment-end bias, minor groove width (MGW) and propeller twist (ProT) are plotted and the ideal is log2(Freq in input/Freq in ref)=0. In plots of other biases, the ideal line is the median signal. (E) PCR amplification introduces bias into STARR-seq libraries. The impact of Gibbs free energy bias is shown for PER1 BAC libraries amplified with different numbers of PCR cycles (3, 6, 12, and 18 cycles). Each point represents the sum of signals in a 500-bp window from three technical replicates. The solid line is a lowess fit line. The dashed ideal line is the median signal across all windows.


