
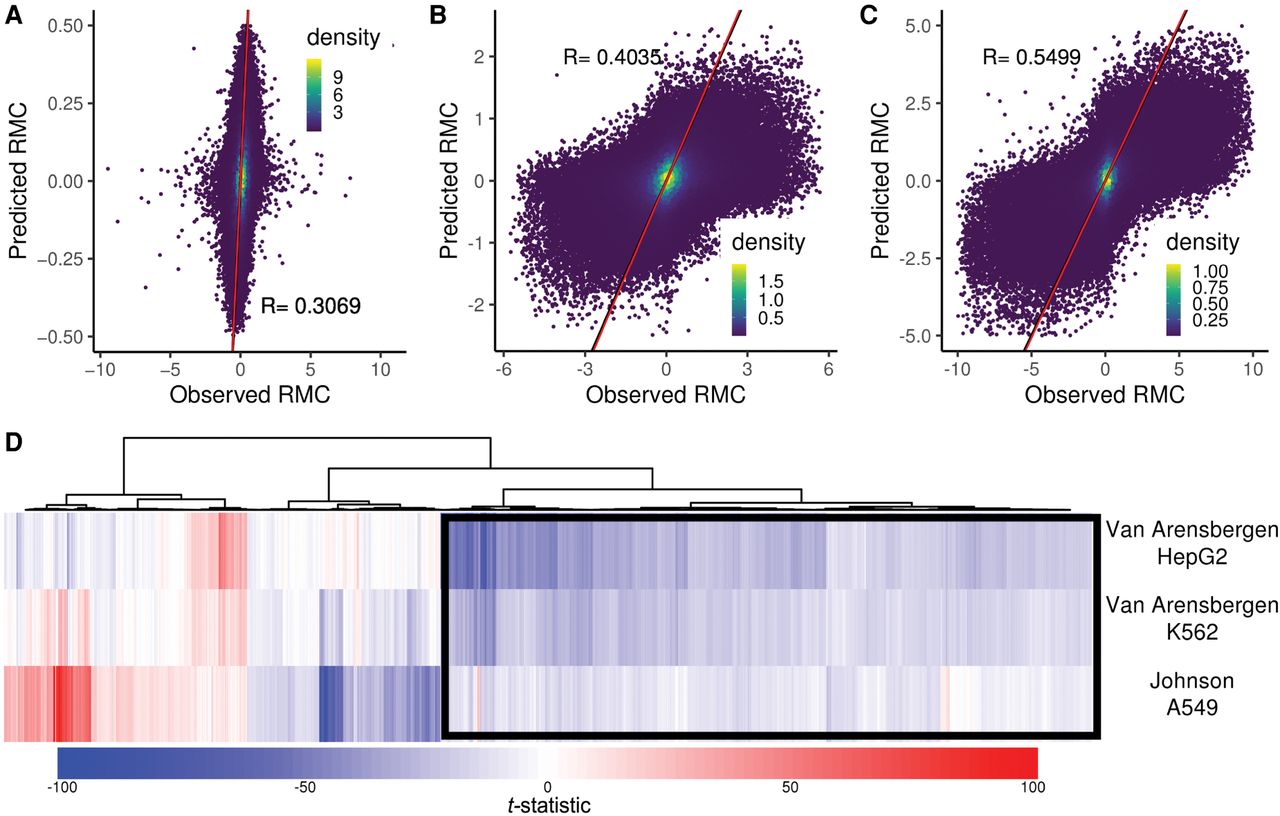
Sequence drivers of RMC. A linear model based on monomer, dimer, and octamer frequencies was trained on Chromosome 1 for three data sets. Model-predicted RMC values for Chromosome 2 are plotted versus actual values for (A) Johnson et al. A549, (B) Van Arensbergen et al. K562, and (C) Van Arensbergen et al. HepG2 cells. The Pearson's R for each model is indicated. Red line represents the model fit. (D) The linear regression t-statistic (effect size) for 3491 octamers (union of 2000 most significant in each data set) is plotted as columns and hierarchically clustered in a heatmap. Each row represents one of three labeled data sets. A positive t-statistic (red in the heatmap) indicates the octamer is associated with positive RMC values, and a negative t-statistic (blue) is associated with negative RMC values. The black box indicates an A-rich cluster of octamers associated with negative RMC in all data sets.


