
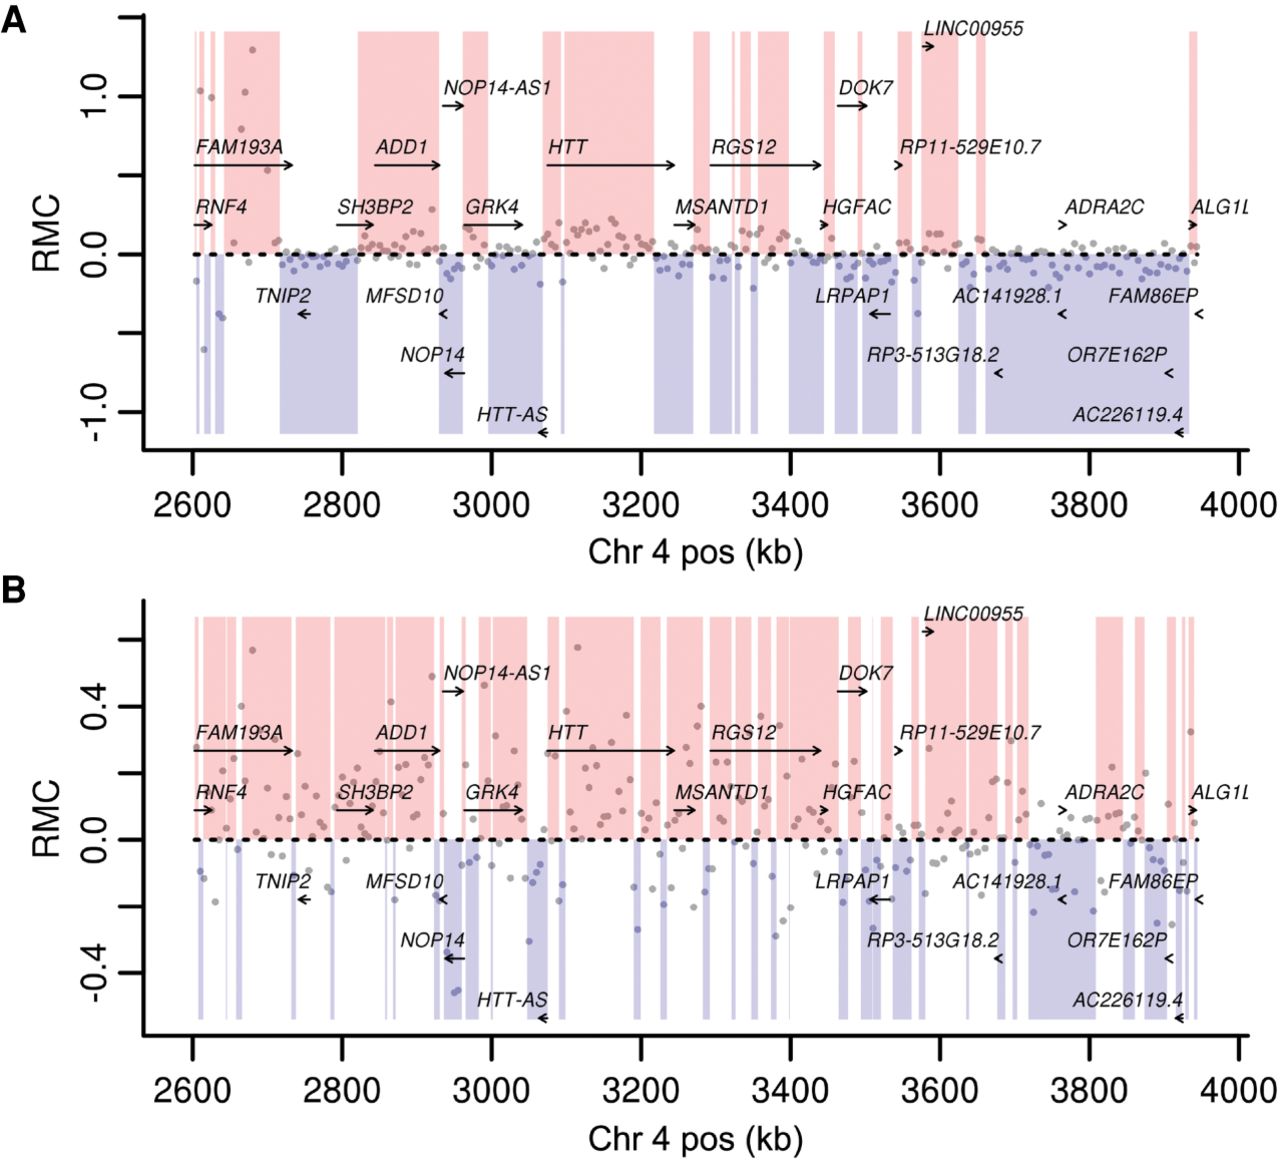
Figure 3.
MPRA strand asymmetry is consistent with gene bodies. Values are plotted in the HTT locus for (A) RMC for STARR-seq signal from a library generated from BACs spanning the HTT locus in K562 cells or (B) RMC from Van Arensbergen et al. whole genome also in K562 cells. Gray dots are average RMC value for 5-kb windows. Pink and blue blocks were assigned to Reference and Complement, respectively, using HMMSeg on each data set with a transition probability of 0.3 (see Methods).


