
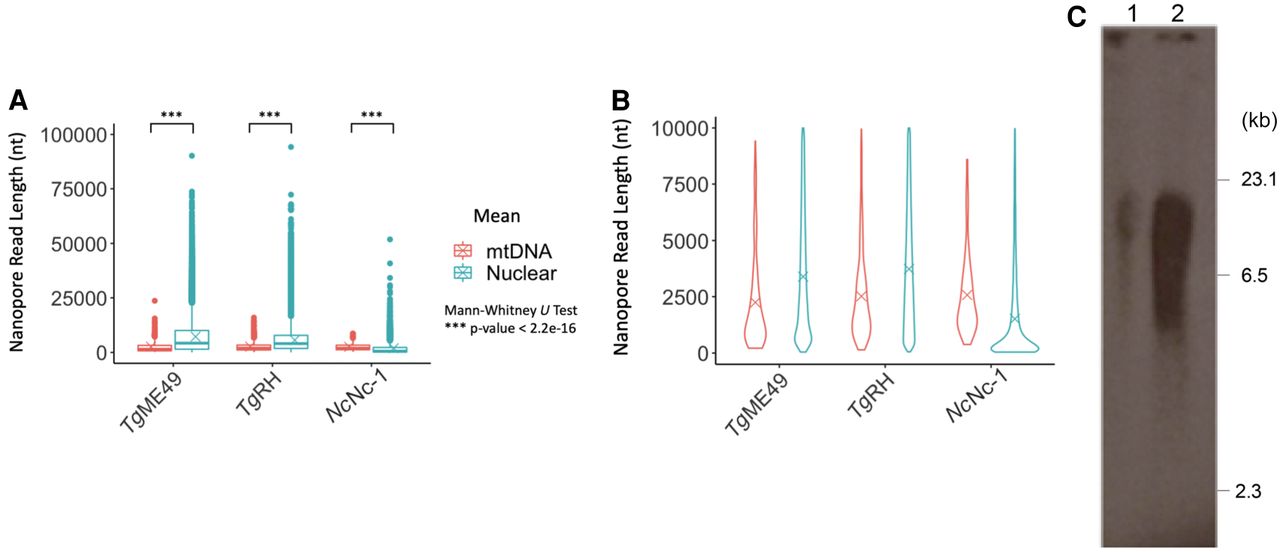
Figure 5.
Size distribution of mtDNA versus nuclear ONT reads. (A) Three ONT runs are plotted and tested for statistical significance. Box plots cover the 25th–75th percentiles. See Supplemental Table S10 for mean and median values. (B) Violin plots of the same ONT reads <10 kb. (C) Southern of a CHEF gel electrophoresis of T. gondii total DNA (lane 1) and mitochondrial-enriched DNA (lane 2) probed with a 1012-bp section of the cob gene. DNA ladder is as indicated.


