
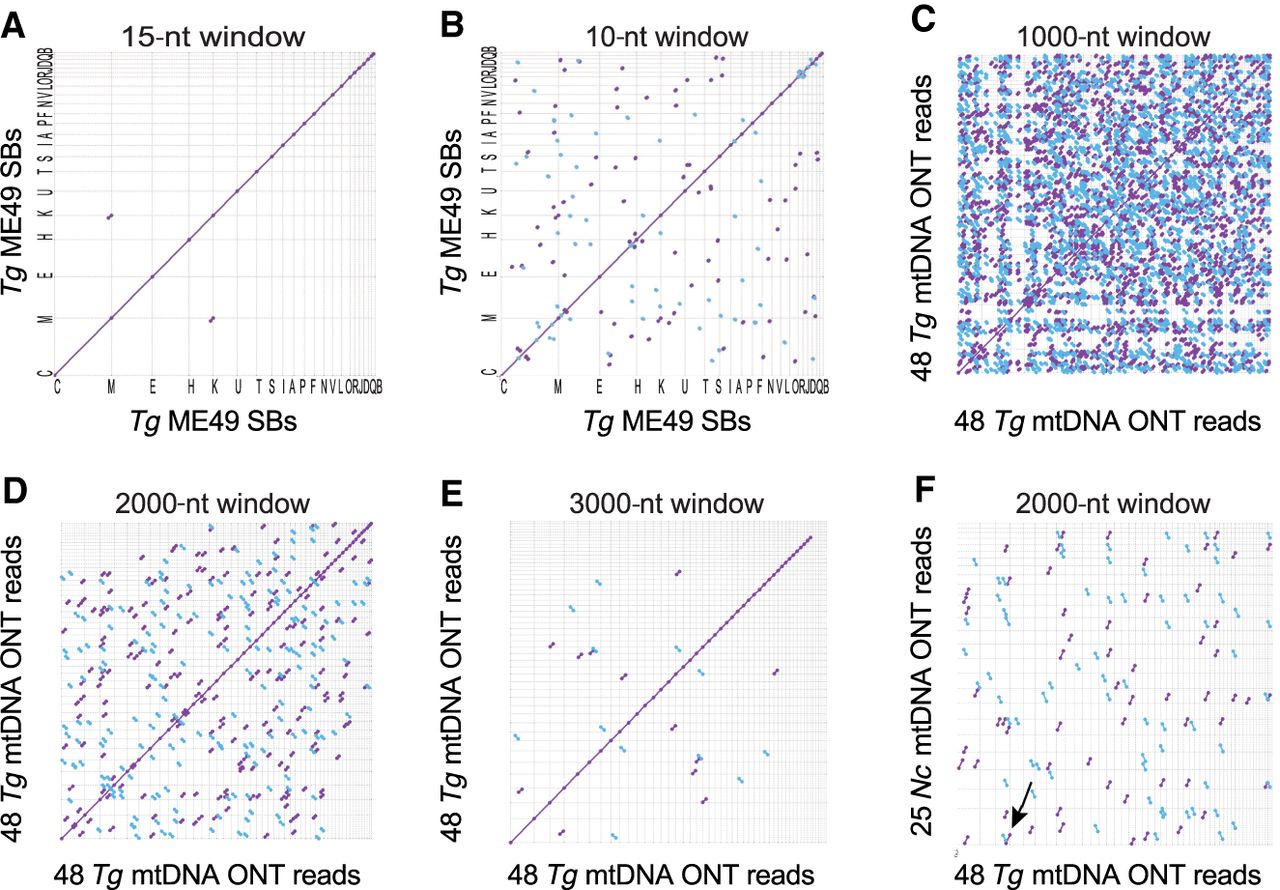
Dot plot comparisons of long T. gondii ME49 mtDNA SBs and ONT reads against themselves and N. caninum Nc-1. (A,B) T. gondii SBs (5909 nt) compared to themselves at differing window sizes; (C–E) 48 mtDNA-specific T. gondii ONT reads (313,102 nt) (Supplemental Methods; Supplemental Fig. S4; Supplemental Data S3) compared to themselves at differing window sizes; (F) 25 N. caninum ONT mtDNA reads (141,161 nt) (Supplemental Methods; Supplemental Fig. S10; Supplemental Data S8) compared to the same 48 mtDNA-specific T. gondii ONT reads and visualized as a dot plot (see also Supplemental Fig. S11). Matches in the forward and reverse orientation are indicated as purple and blue lines, respectively. Sequences were sorted, from longest to shortest. Window size is indicated above each panel. The arrow in F points to the only match observed to be longer than 3000 bp. The names of the sequences located on each axis are located in the Supplemental Methods.


