
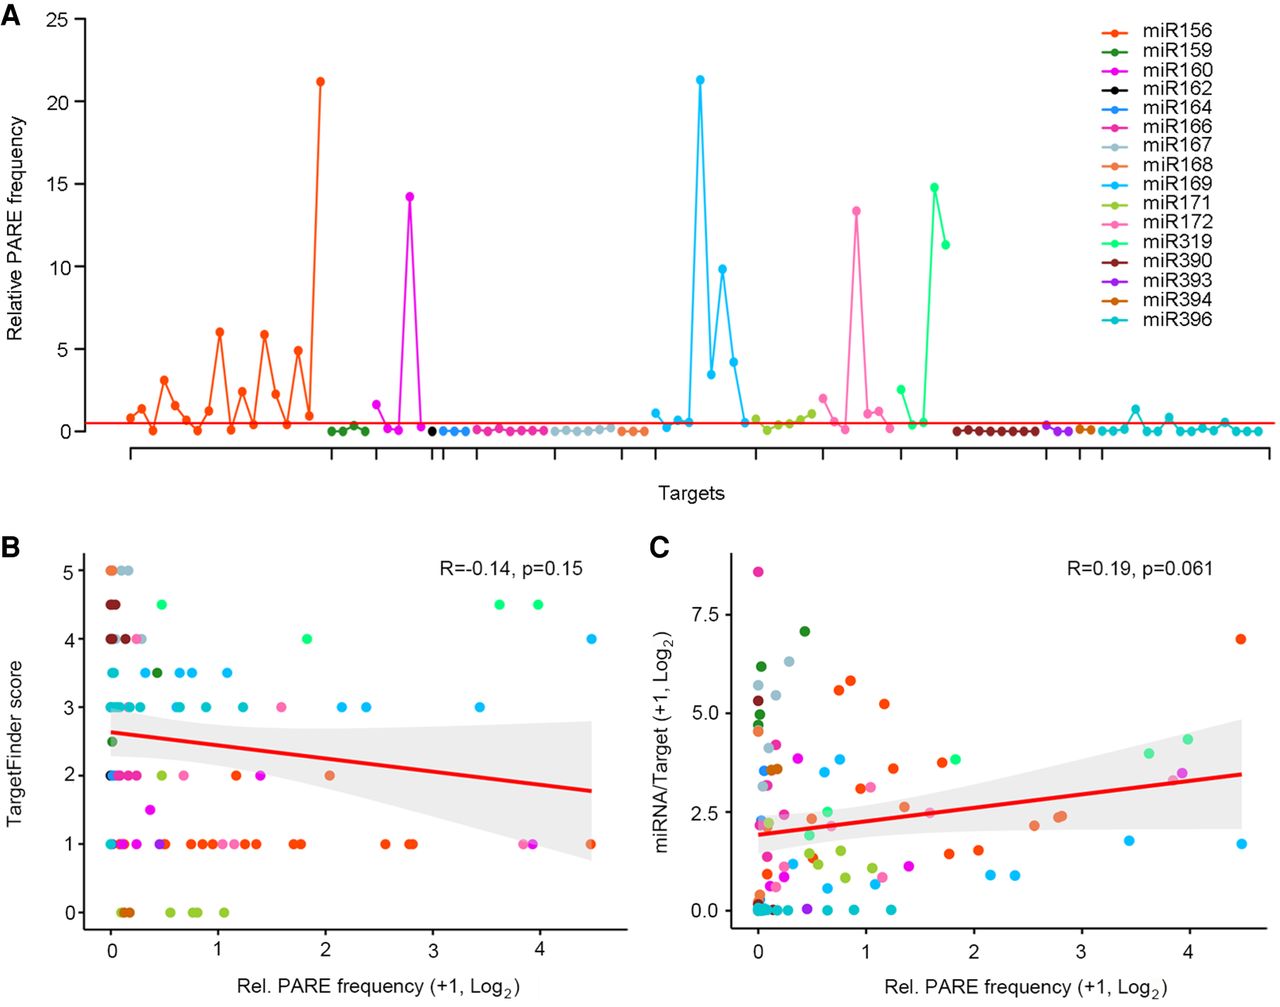
Targets of vasculature-expressed miRNAs show a higher relative PARE frequency. (A) Plot of the relative number of PARE signatures for 102 expressed targets shows this number to be low overall. High relative PARE frequencies, reflecting comparatively strong regulation by way of transcript cleavage, are seen for select targets of the vascular miRNAs: miR156, miR160, miR169, miR172, and miR319. The red line indicates a relative PARE value of 0.5. (B) The relative number of PARE signatures for natural targets is not correlated to complementarity strength as defined by TargetFinder score. (C) The relative PARE frequency of targets is likewise not correlated to the miRNA-to-target expression ratio. The 95% confidence area is marked in gray.


