
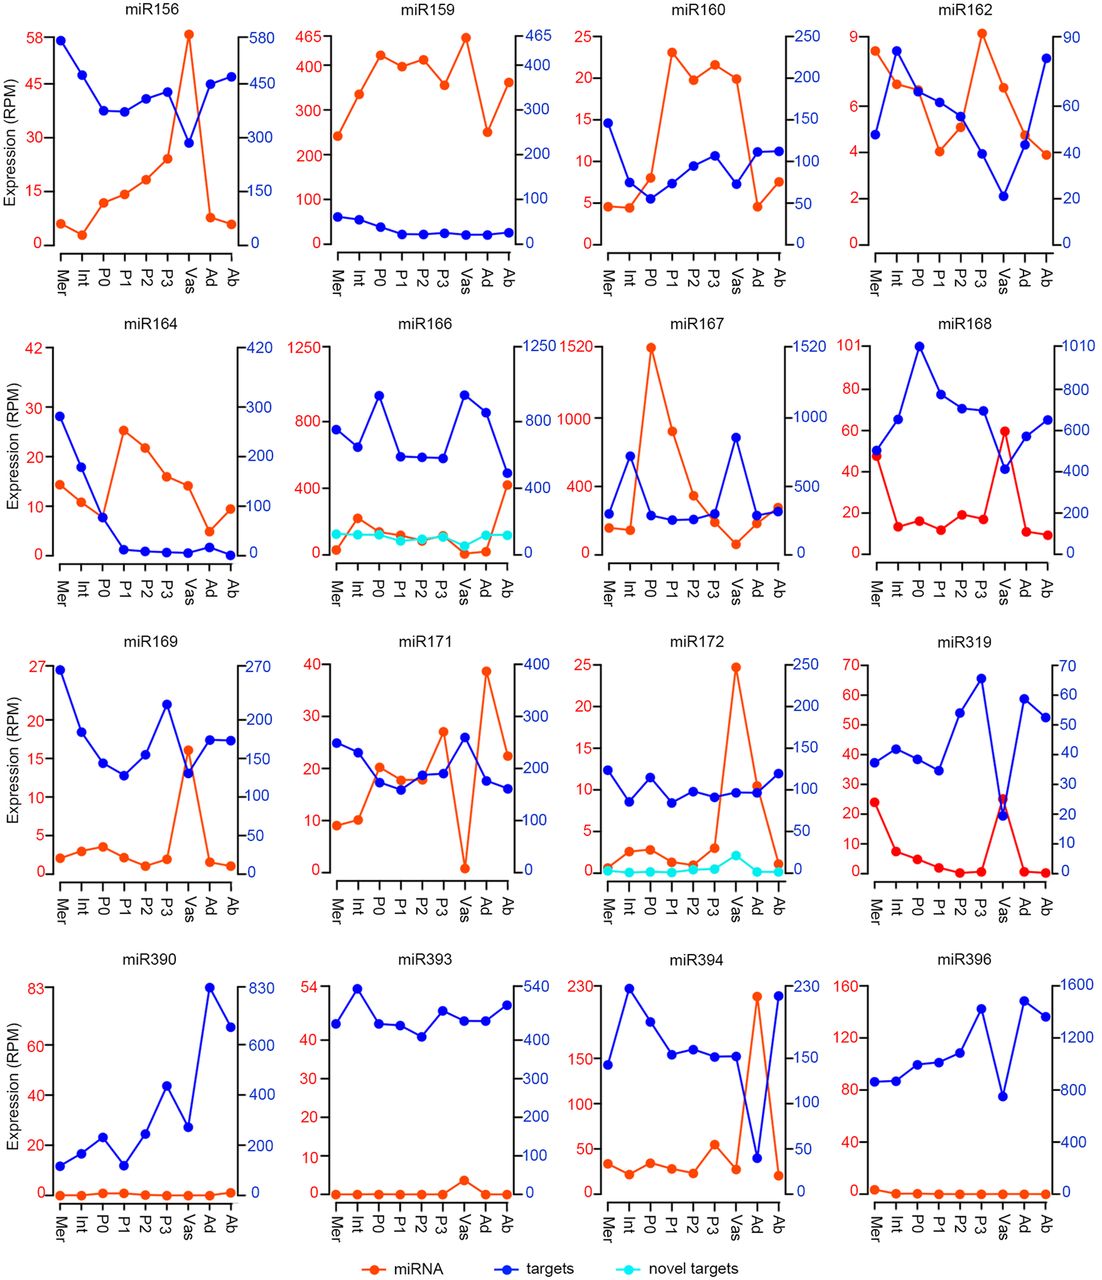
Figure 5.
Broad coexpression of miRNA precursors and targets. Plots depicting total precursor and target transcript levels for a given miRNA family across the maize apex domains show considerable coexpression. (Left axis in red) Sum expression of all precursors in a miRNA family; (right axis in dark blue) sum expression of all targets of the given miRNA family; (light blue lines) expression levels of novel targets (right-hand scale). For ease of visualization, only select precursor and target profiles are shown at the same scale; most are shown at a 1:10 miRNA:target scale.


