
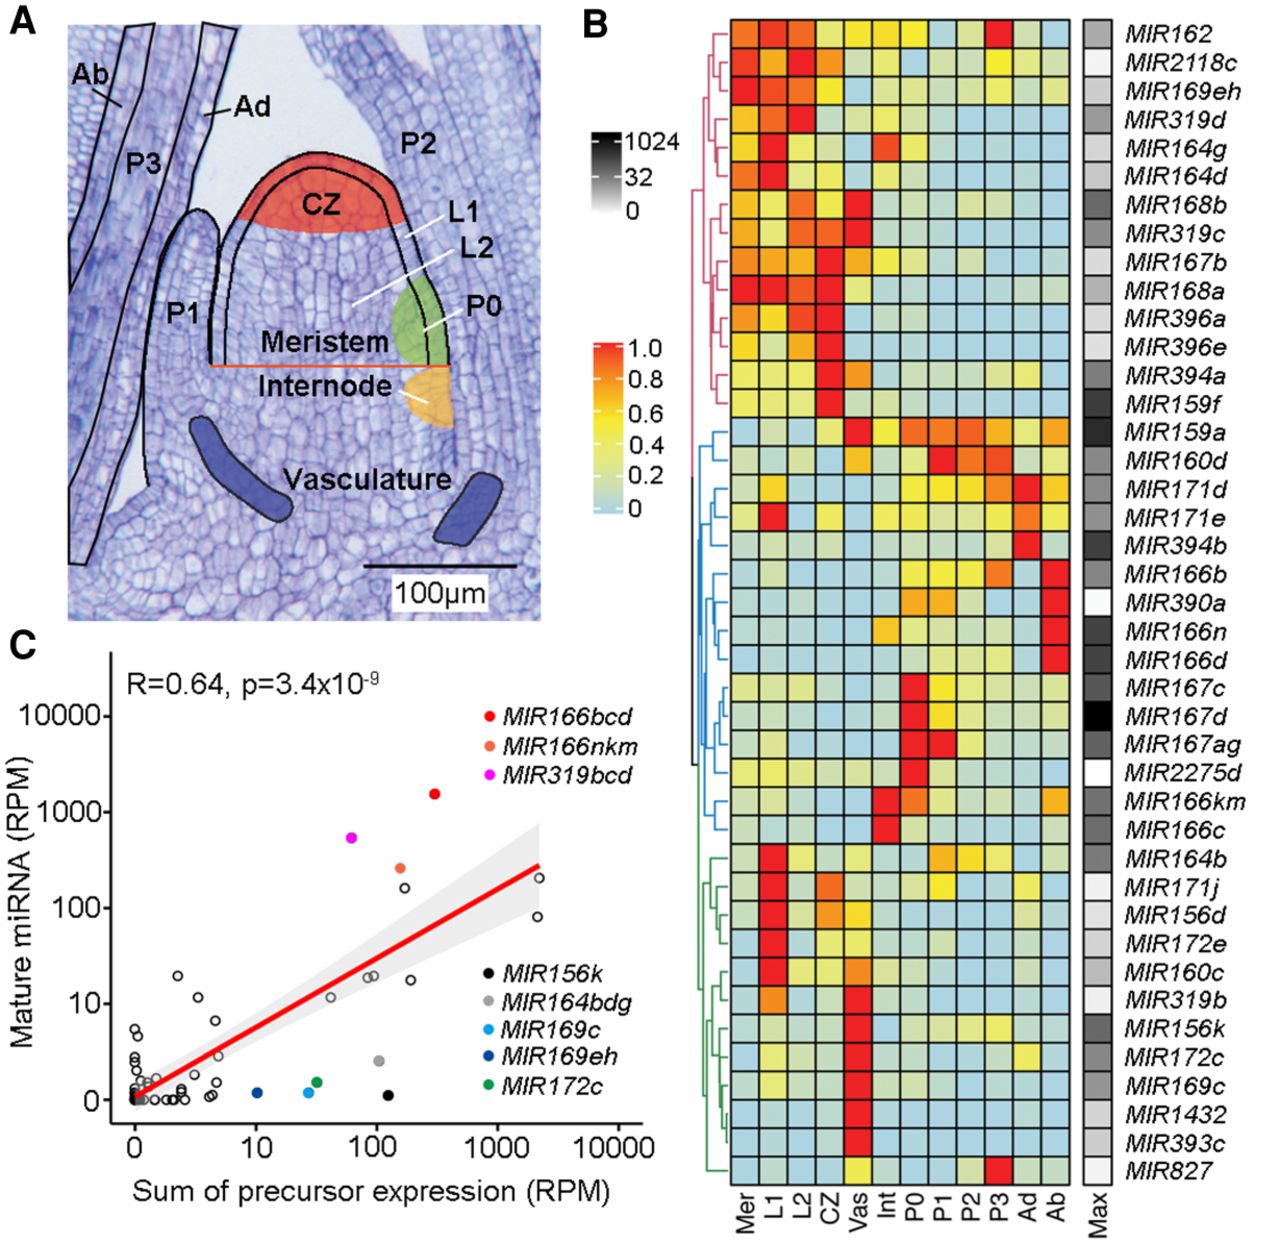
The patterns and levels of miRNA accumulation are principally determined at the transcriptional level. (A) Longitudinal section of a B73 maize seedling apex illustrating the 12 domains represented in the expression atlas. Adapted from Knauer et al. (2019). (B) Heatmap of 41 miRNA precursors expressed (RPM ≥1) across the maize shoot apex domains. Hierarchical clustering reveals three major clusters. Expression values are normalized per precursor from 0 (lowest value) to 1 (highest value) (Methods). The maximum expression value (RPM) of precursors across all domains is shown to the right of the heatmap (black–white scale). (Mer) meristem; (CZ) central zone; (Int) internode; (Vas) vasculature; (Ad) adaxial; (Ab) abaxial; (Max) maximum expression. (C) Mature miRNA and precursor expression levels are highly significantly correlated (r = 0.64, P < 3.4 × 10⁻⁹). Prominent outliers with higher or lower than expected mature miRNA levels are highlighted.


